Uploaded image for project: 'Core Server'
  1. Core Server
  2. SERVER-16150

Large in memory collection scan very slow with WiredTiger compared to mmapv1

    • ALL
    • Hide

      Add a large amount of data into a collection (my test data generation is outlined in this gist).

      Here are the various storage config options used:

      //mmapv1
      
      storage:
          dbPath: "/ssd/db/mmap"
          engine: "mmapv1"
      
      //WT with compression off
      
      storage:
          dbPath: "/ssd/db/wt_none"
          engine: "wiredtiger"
          wiredtiger:
              collectionConfig: "block_compressor="
      
      // WT with snappy
      
      storage:
          dbPath: "/ssd/db/wt_snappy"
          engine: "wiredtiger"
      
      // WT with zlib
      
      storage:
          dbPath: "/ssd/db/wt_zlib"
          engine: "wiredtiger"
          wiredtiger:
              collectionConfig: "block_compressor=zlib"
      

      To force a collection scan, run the following:

      var start = new Date().getTime();
      db.data.find().explain("executionStats")
      var end = new Date().getTime();
      print("Time to touch data: " + (end - start) + "ms");
      

      Start and end are not really required since this is an explain and contains timing info, but I was also using this to compare to (for example) the touch command, so I wanted apples to apples timing comparisons.

      Show
      Add a large amount of data into a collection (my test data generation is outlined in this gist ). Here are the various storage config options used: //mmapv1 storage: dbPath: "/ssd/db/mmap" engine: "mmapv1" //WT with compression off storage: dbPath: "/ssd/db/wt_none" engine: "wiredtiger" wiredtiger: collectionConfig: "block_compressor=" // WT with snappy storage: dbPath: "/ssd/db/wt_snappy" engine: "wiredtiger" // WT with zlib storage: dbPath: "/ssd/db/wt_zlib" engine: "wiredtiger" wiredtiger: collectionConfig: "block_compressor=zlib" To force a collection scan, run the following: var start = new Date().getTime(); db.data.find().explain( "executionStats" ) var end = new Date().getTime(); print( "Time to touch data: " + (end - start) + "ms" ); Start and end are not really required since this is an explain and contains timing info, but I was also using this to compare to (for example) the touch command, so I wanted apples to apples timing comparisons.

      This may be "works as designed" (i.e. that WT is going to be slower for traversing large data structures in memory) but I would like to make sure and quantify the expected behavior here if that is the case.

      While attempting to profile the benefits of compression in terms of bandwidth savings, the expected performance of the default snappy compression (which delivered decent on-disk compression) looked slower than expected, significantly slower than mmapv1.

      That led to a round of testing to better understand what was going on here. So, I used 4 basic storage engine configurations:

      • mmapv1
      • WT with no compression ("block_compressor=")
      • WT with snappy (default, so no block_compressor specified)
      • WT with zlib ("block_compressor=zlib")

      The only WT config that came close to the mmapv1 performance was zlib, and that was on the read from disk test. So, I decided to test on SSD rather than spinning media, the result was that everything got a bit faster, but the relative differences remained - WT was still significantly slower.

      For my initial testing methodology, since I was trying to demonstrate the benefits of compression for IO bandwidth savings, I had been clearing the caches on the system after each run.

      Now that IO appeared to have no effect I decided to do consecutive runs of the collection scan, which would make the second run all in-memory (the collection is <16GiB and the test machine has 32GiB RAM, even with indexes it would fit in memory, but indexes are not in play)

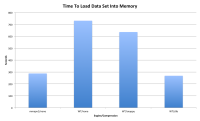
      However the collection scan was still slow with WiredTiger even when the data was already loaded into RAM. The mmapv1 test dropped from the ~300 second range down to 13 seconds, but the WT testing showed no similar reduction - it did improve, but was still in the hundreds of seconds range rather than double digits.

      I have tried tweaking cache_size, lsm, directio, readahead to no effect (the last two before I had ruled out IO issues completely), but no significant improvement either.

      Basic initial graph attached, I will add detailed timing information, graphs, perf output below to avoid bloating the description too much.

            Assignee:
            mathias@mongodb.com Mathias Stearn
            Reporter:
            adam@comerford.net Adam Comerford
            Votes:
            0 Vote for this issue
            Watchers:
            20 Start watching this issue

              Created:
              Updated:
              Resolved: