-
Type:
Bug
-
Resolution: Fixed
-
Priority:
Major - P3
-
None
-
Affects Version/s: 4.2.1
-
Component/s: None
-
None
-
Fully Compatible
-
ALL
I have a 3-node replica set running version 4.2.1 on Ubuntu 18.04. Previously we had been on 4.0.4. I'm noticing that the cluster is significantly slower than it was in 4.0.4 both in terms of bulk insert speed on the primary, impact on the speed of other operations while those inserts jobs are running, and the replication lag we see on the secondaries.
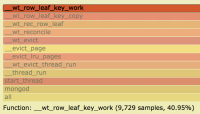
I think at least on the primary this has something to do with elevated cache pressure, but I'm kind of just guessing. I'm happy to provide diagnostic files and logs privately.
We're now running with featureCompatibilityVersion 4.2, flow control off, and enableMajorityReadConcern false, and have had some improvement, but we're still in trouble with cache pressure and insert speed, and the replication lag is quite high when we're running jobs that insert millions of records.
Some performance numbers, each with upwards of 15-25m rows:
- With all nodes on 4.0.4: a job averaged 875 rows/sec. The local secondary mostly kept up (maybe 10-60 seconds lag). The geographically remote secondary was never more than 300 seconds behind.
- With the secondaries on 4.2.1 and the primary on 4.0.4: a job averaged 484 rows/sec. Both secondaries were about 5000-10000 seconds behind by the end of the job.
- On a similar but standalone node on 4.2.1, the job averaged 4012 rows/sec
- With all nodes on 4.2.1 and default settings for flowControl and enableMajorityReadConcern: average 265 rows/sec and all other operations were significantly impacted.
- After disabling flowControl: average 712 rows/sec, but both replicas were about 5000 seconds lagged and all other operations were significantly delayed, for example I saw a document update take 62673ms with {{timeWaitingMicros: { cache: 62673547 }}}
- After disabling flowControl and setting enableMajorityReadConcern to false: no specific insert number but I'm seeing "tracked dirty bytes in the cache" at about 1.5 GB while an insert job is running. One secondary is lagged by 4 sec and the other by 1183 sec.
A couple of notes on our setup:
- Our bulk inserts are of ~2.5 KB documents with a large number of indexes (20, one of which is multi-key - array of strings);
- We do have a couple of change stream listeners (not on the same collection being written to by bulk writes) so some level of majority read concern is still being supported (I suppose)
- is related to
-
SERVER-44881 Giant slow oplog entries are being logged in full
-
- Backlog
-
- related to
-
SERVER-44991 Performance regression in indexes with keys with common prefixes
-
- Closed
-
