-
Type:
Bug
-
Resolution: Won't Fix
-
Priority:
 Major - P3
-
Affects Version/s: 1.16.3, 1.28.4
-
Component/s: Schema
-
None
-
Not Needed
-
None
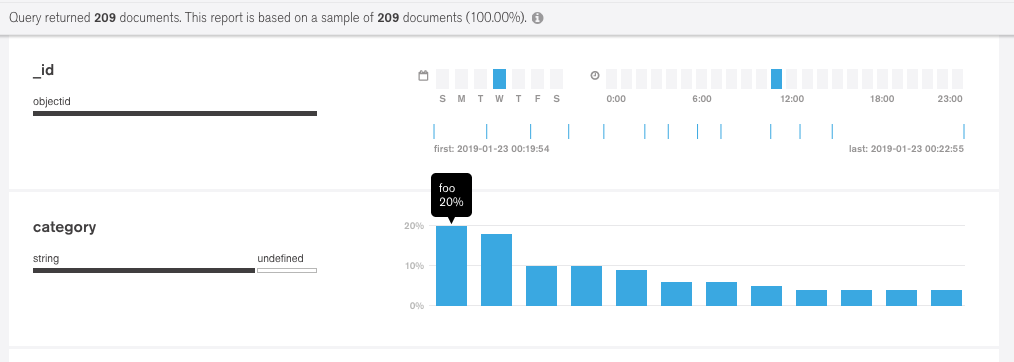
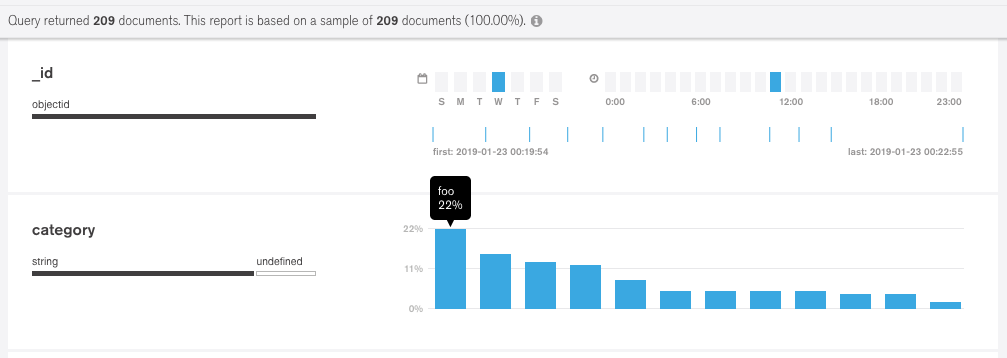
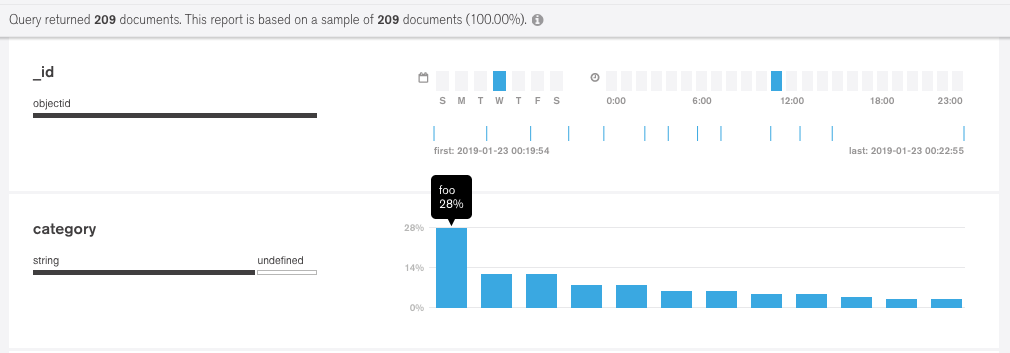
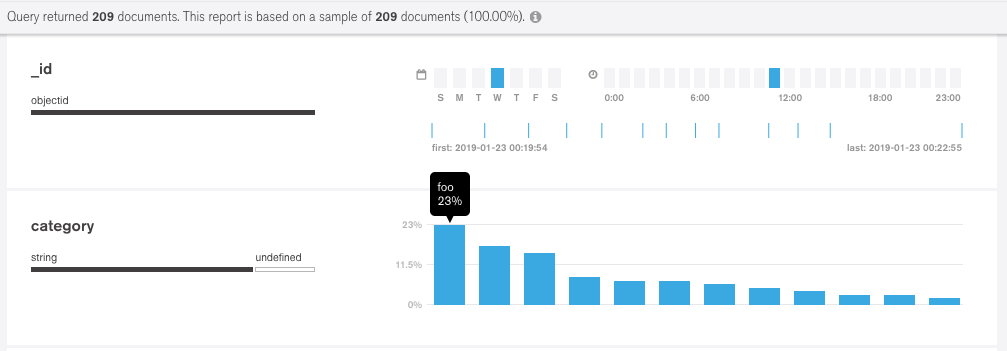
Compass Schema Analyser renders different graph result for a small dataset (less than 1000 documents).
Example data:
for(x=0;x<40;x++){db.test.insert({category:"foo"})}
for(x=0;x<24;x++){db.test.insert({category:"bar"})}
for(x=0;x<20;x++){db.test.insert({category:"baz"})}
for(x=0;x<15;x++){db.test.insert({category:"foz"})}
for(x=0;x<13;x++){db.test.insert({category:"for"})}
for(x=0;x<11;x++){db.test.insert({category:"bam"})}
for(x=0;x<9;x++){db.test.insert({category:"baw"})}
for(x=0;x<8;x++){db.test.insert({category:"bae"})}
for(x=0;x<7;x++){db.test.insert({category:"fog"})}
for(x=0;x<6;x++){db.test.insert({category:"com"})}
for(x=0;x<6;x++){db.test.insert({category:"cow"})}
for(x=0;x<5;x++){db.test.insert({category:"cop"})}
for(x=0;x<45;x++){db.test.insert({field:"some"})}
Test of manual $sample output:
db.test.aggregate([{$sample:{size:1000}}, {$group:{_id:"$category", count:{$sum:1}}}])
The should show that `foo` still outputs consistently of 40 documents. In Compass Schema, the percentage of value `foo` can range from 20%-28% (See screenshot)
Note that the bar shows : This report is based on a sample of 209 documents (100.00%)
MongoDB version: 4.0.5
Compass version: 1.16.3 Community