-
Type:
Bug
-
Resolution: Fixed
-
Priority:
Major - P3
-
Affects Version/s: None
-
Component/s: Explain
-
None
-
Environment:Compass 1.35.0, Mac
-
3
-
Iteration Whale, Iteration Xantic Sargo
-
Not Needed
-
None
Problem Statement/Rationale
What is going wrong? What action would you like the Engineering team to take?
Please be sure to attach relevant logs with any sensitive data redacted.
Incorrect calculation of "Actual query execution time" for explain plan of aggregation
Steps to Reproduce
How could an engineer replicate the issue you’re reporting?
Connect Compass to an unsharded MongoDB 6.0.4 replica set (this bug may also be reproducible on older versions, or sharded sets but I have not attempted this).
Create an aggregation from a collection that executes with a cursor in the first stage, and lookup stages that are resolved using 'explainVersion: 2' (slot based execution)
- Ideally a long-running aggregation pipeline with multiple stages to accentuate the bug
Click "Explain" and wait for the "Explain Plan" modal to resolve.
Expected Results
What do you expect to happen?
Accurate "Actual query execution time" to be displayed
Actual Results
What do you observe is happening?
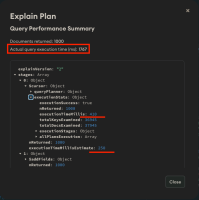
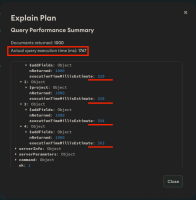
Actual query execution time appears to be inflated as the sum of
stages.0.$cursor.executionStats.executionTimeMillis
+ ... stages.[1...n].executionTimeMillisEstimate
It appears that the stages.0.$cursor.executionStats.executionTimeMillis value is infact the total execution time of the aggregation for all stages
The values for stages.[1...n].executionTimeMillisEstimate appear to be cumulative running totals (so should not be summed in any case?)
Additional Notes
Any additional information that may be useful to include.
This calculation appears to happen here: https://github.com/mongodb-js/compass/blob/67beee814b386f1b31e6f72230f655af04a59fa2/packages/explain-plan-helper/src/get-execution-stats.ts#L110-L118


