-
Type:
Bug
-
Resolution: Fixed
-
Priority:
Major - P3
-
Affects Version/s: None
-
Component/s: Connectivity
-
None
-
None
-
None
-
None
-
None
-
None
-
None
-
None
We're seeing an issue when connecting to an Atlas cluster with version 2.10.4 of the driver. When the connection cannot be established (e.g. the client IP is not in Atlas' whitelist), the heartbeat on the client keeps running, and every time it executes it creates instances of MongoConnectionException that are never collected, causing a memory leak.
I was not able to reproduce the problem connecting to a local standalone instance nor a local replica set. The only obvious difference between my local replica set and Atlas is that the local one does not use SSL.
A trivial example that does nothing but connect to the cluster (when the client IP is not whitelisted), reproduces this problem:
using System;
using MongoDB.Driver;

namespace MinimalRepro
{
    class Program
    {
        static void Main(string[] args)
        {
            try
            {
                var mc = new MongoClient("mongodb+srv://admin:<password-goes-here>@cluster0-pl5td.azure.mongodb.net/test?retryWrites=true&w=majority");
            }
            catch (Exception e)
            {
                Console.WriteLine($"Failure: {e.GetType().Name} - {e.Message}");
            }
            Console.WriteLine("Just waiting. Program memory will keep growing. Hit ENTER to exit");
            Console.ReadLine();
        }
    }
}
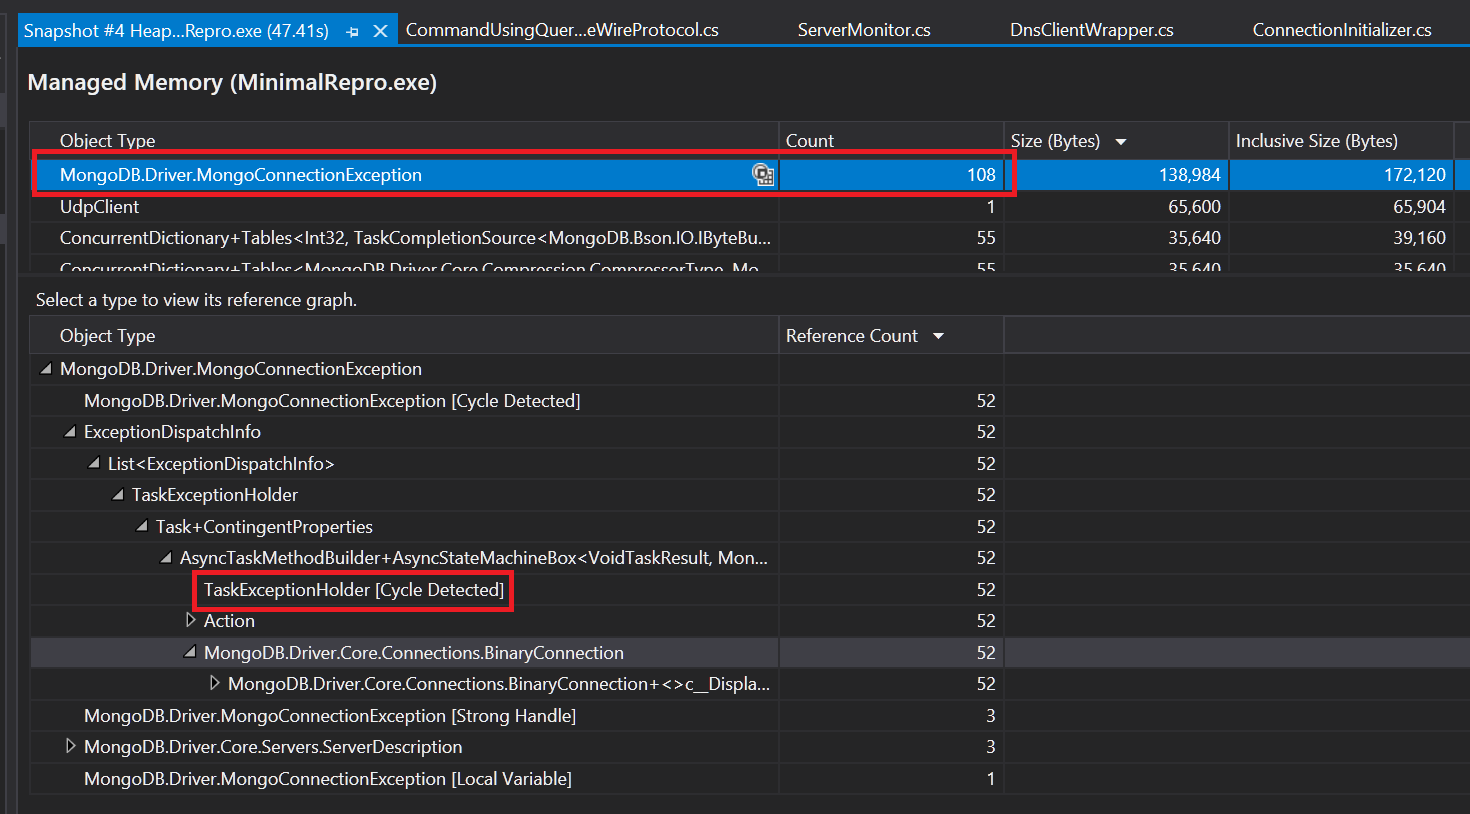
The program memory slowly but steadily increases, and snapshots of the memory heap show that more and more instances of MongoConnectionException are accumulating every time. Changing the heartbeat frequency has the impact you'd expect on the memory growth rate.
I'm not an expert interpreting Visual Studio's debugging info about memory, but two things caught my eye in the screenshot below: the "Cycle Detected" message (a circular reference sounds like it could be preventing the exceptions from being collected), and seeing "TaskExceptionHolder" in there, which makes me think that there's a task somewhere that's throwing an exception but is not being observed (i.e. awaited), so the exceptions are never thrown and just pile up in unreferenced tasks.

This might be related to CSHARP-2490.