-
Type:
Bug
-
Resolution: Cannot Reproduce
-
Priority:
 Unknown
-
None
-
Affects Version/s: 1.5.1
-
Component/s: None
-
None
-
None
-
None
-
None
-
None
-
None
Hello
I'm making repeated `Find` calls to mongo db via the mongodb go driver (v1.5.1). I'm noticing that the cpu/mem/network usage keeps increasing over a long period of time. Performing a pprof profiling hinted that it was the `Find` library call that's constantly making heap allocations. So I wrote a barebones program that emulates the behaviour, and noticed that it was indeed the mongo driver's `Find` method that was responsible.
Following is the program:
package main

import (
   "context"
   "fmt"
   "github.com/gorilla/mux"
   "go.mongodb.org/mongo-driver/bson"
   "go.mongodb.org/mongo-driver/mongo"
   "go.mongodb.org/mongo-driver/mongo/options"
   "net/http"
   _ "net/http/pprof"
   "time"
)
func main() {
   m := mux.NewRouter()
   m.PathPrefix("/debug/").Handler(http.DefaultServeMux)
   srv := http.Server{
      Addr: ":8889",
      Handler: m,
   }

   go func() {
      err := srv.ListenAndServe()
      if err != nil {
         fmt.Println("unable to start server")
      }
   }()

   ctx := context.Background()
   dbUser := "dbUser"
   dbName := "dnName"
   dbPwd := "dbPwd"
   collectionName := "collName"
   hostInfos := "localhost:27017"

   connectURL := fmt.Sprintf("%s:%s@%s", dbUser, dbPwd, hostInfos)
   mongoConnectURL := "mongodb://%s"
   mongoURI := fmt.Sprintf(mongoConnectURL, connectURL)

   clientOptions := options.Client().ApplyURI(mongoURI)

   maxIdleTimeout := 15 * time.Minute
   clientOptions.MaxConnIdleTime = &maxIdleTimeout

   client, err := mongo.Connect(ctx, clientOptions)
   if err != nil {
      panic(err)
   }
   defer client.Disconnect(ctx)

   col := *client.Database(dbName).Collection(collectionName)

   var limit *int64
   a := int64(100)
   limit = &a

   key := bson.M{
      ... // bson document
   }

   // using a short duration to speed up the observation
   // in reality it is 10 sec, but the cpu/mem increase is over a much longer time then
   ticker := time.NewTicker(10 * time.Millisecond)
   findOpts := &options.FindOptions{
      Limit: limit,
   }

   for {
      select {
      case <-ticker.C:
         fmt.Println("finding...")
         cursor, err := col.Find(context.Background(), key, findOpts)
         if err != nil {
            panic(err)
         }
         err = cursor.Close(ctx)
         if err != nil {
            panic(err)
         }
         fmt.Println("done finding...")
      }
   }
}
Notice that the ticker interval is 10ms, whereas in our real program it's 10sec. I've reduced it to speed up the observations.
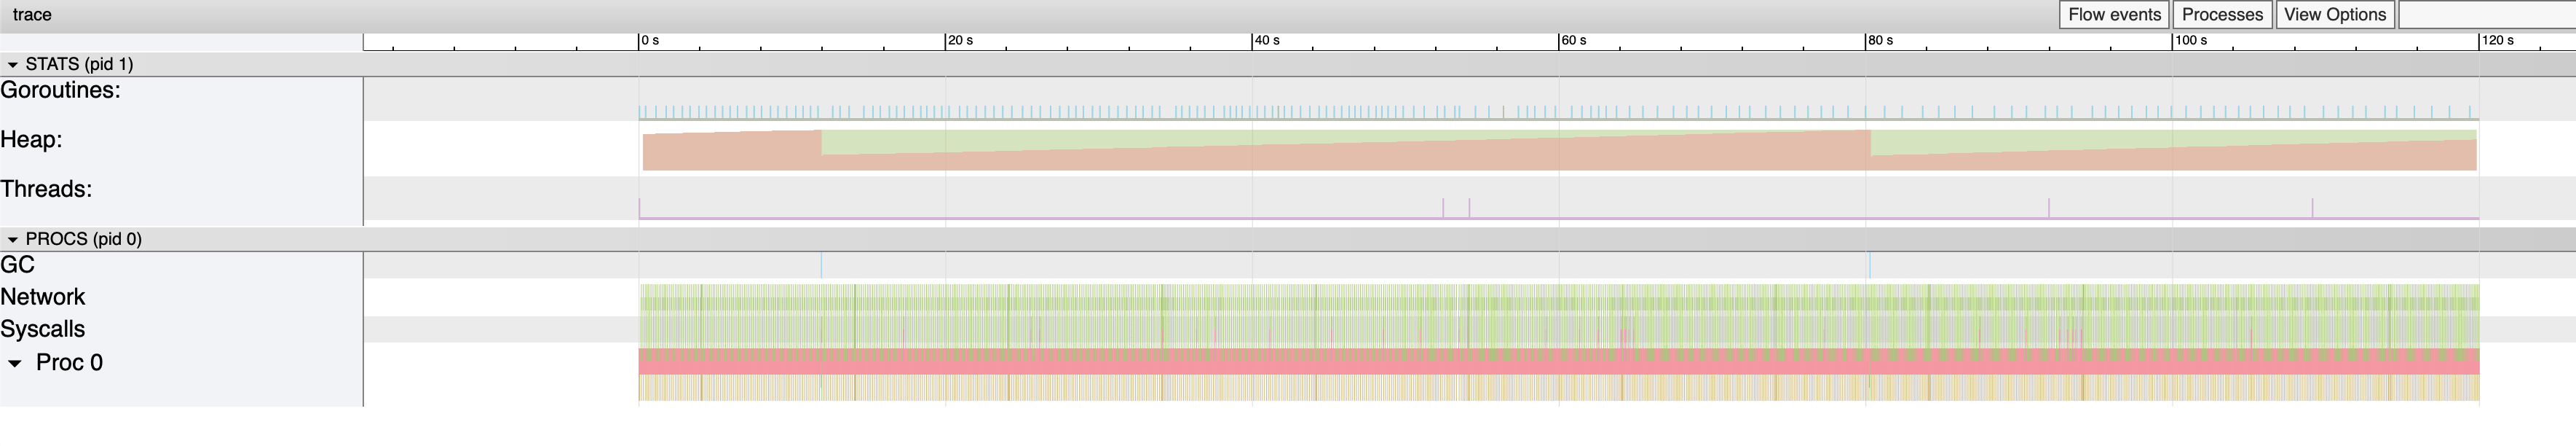
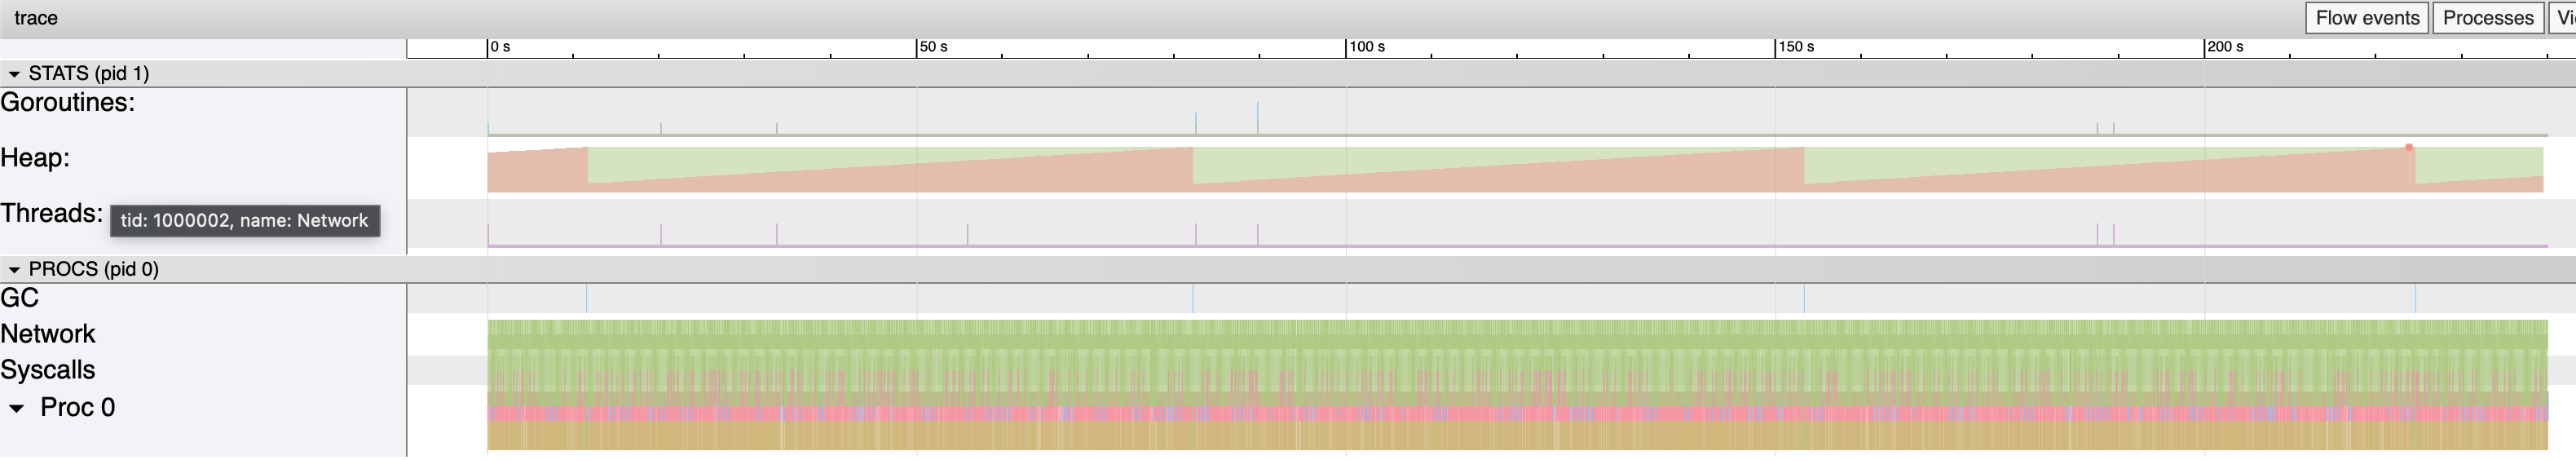
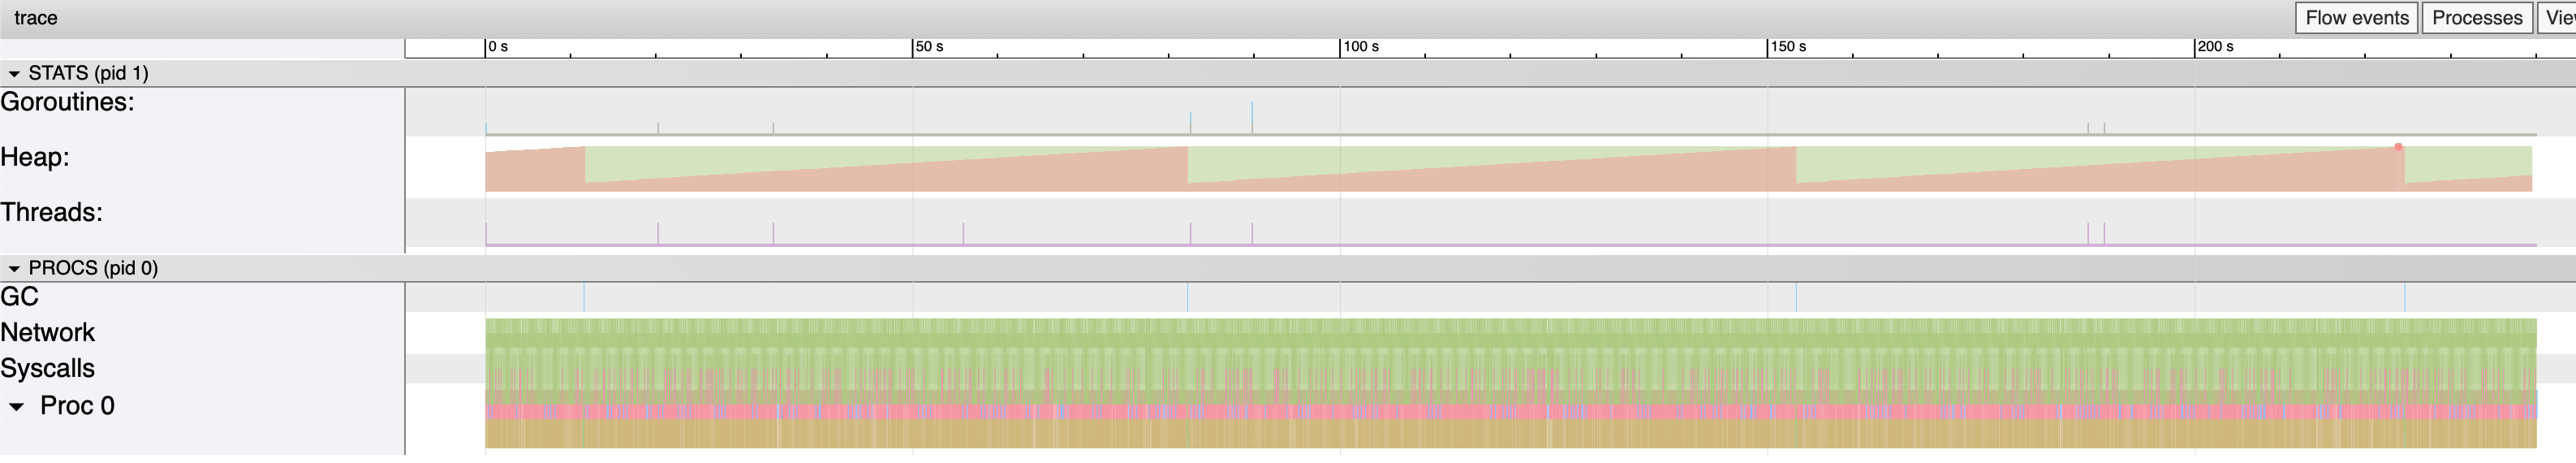
While this runs, the pprof trace profile shows the following:

The heap allocations above keep increasing at a constant rate.
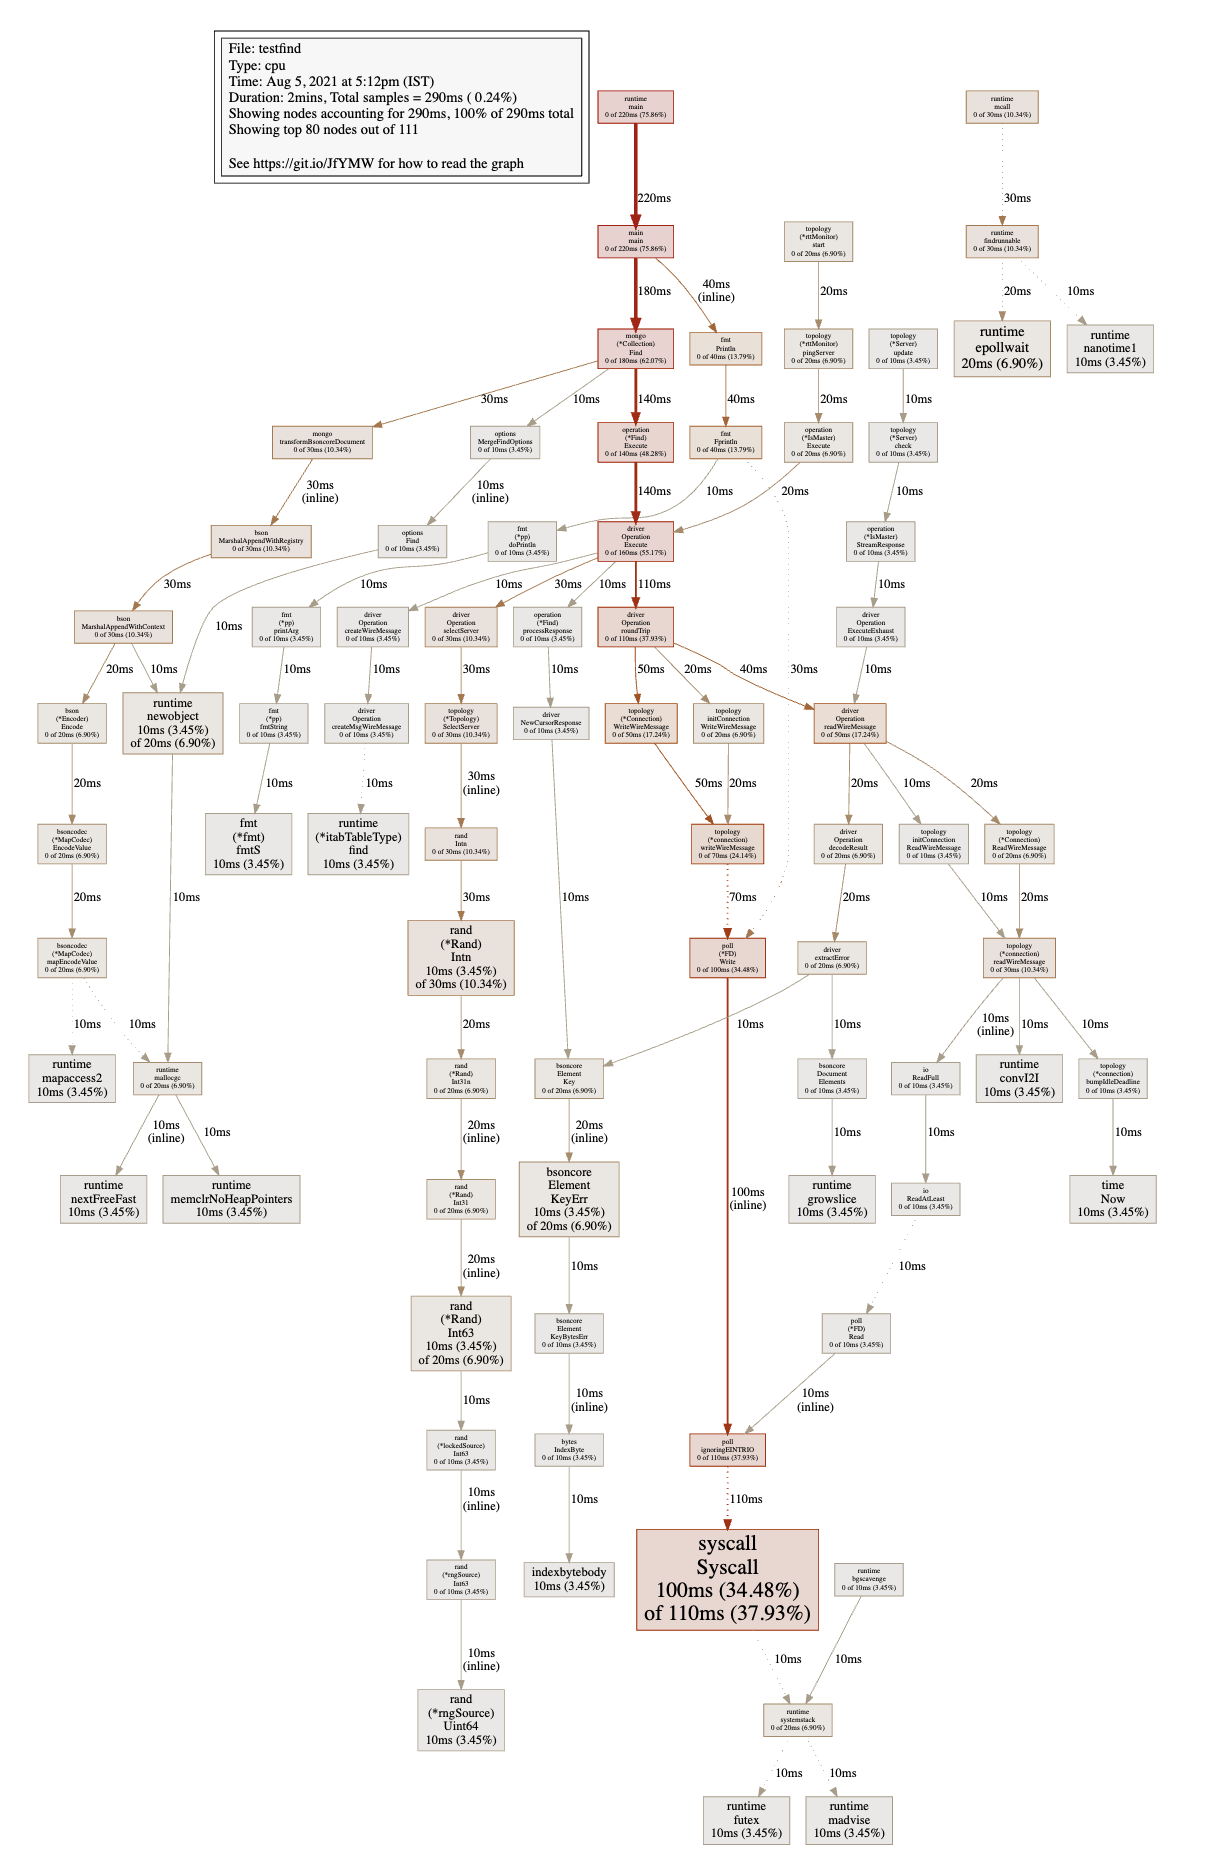
The pprof cpu profile show the following:

Any idea about this? Is this a known issue, and if so, is there a resolution?