-
Type:
Question
-
Resolution: Works as Designed
-
Priority:
 Unknown
-
None
-
Affects Version/s: None
-
Component/s: None
-
None
-
None
-
None
-
None
-
None
-
None
-
None
-
None
Hello,
In the official Motor documentation it is written that issues/bugs should be added directly here. That's why I created an account an want to do that with an issue we are currently facing. ![]()
In our company we are using a MongoDB database running on an EC2 instance in AWS deployed with the MongoDB package by Bitnami (https://bitnami.com/stack/mongodb ).
To communicate with this database, we use a python backend implemented with FastAPI for the controllers and Beanie/Motor for the database calls. Because our collections use schema-versioning, we need a mapping before the data can be loaded into the corresponding data-class and that's why we often use Motor calls instead of the direct Beanie calls.
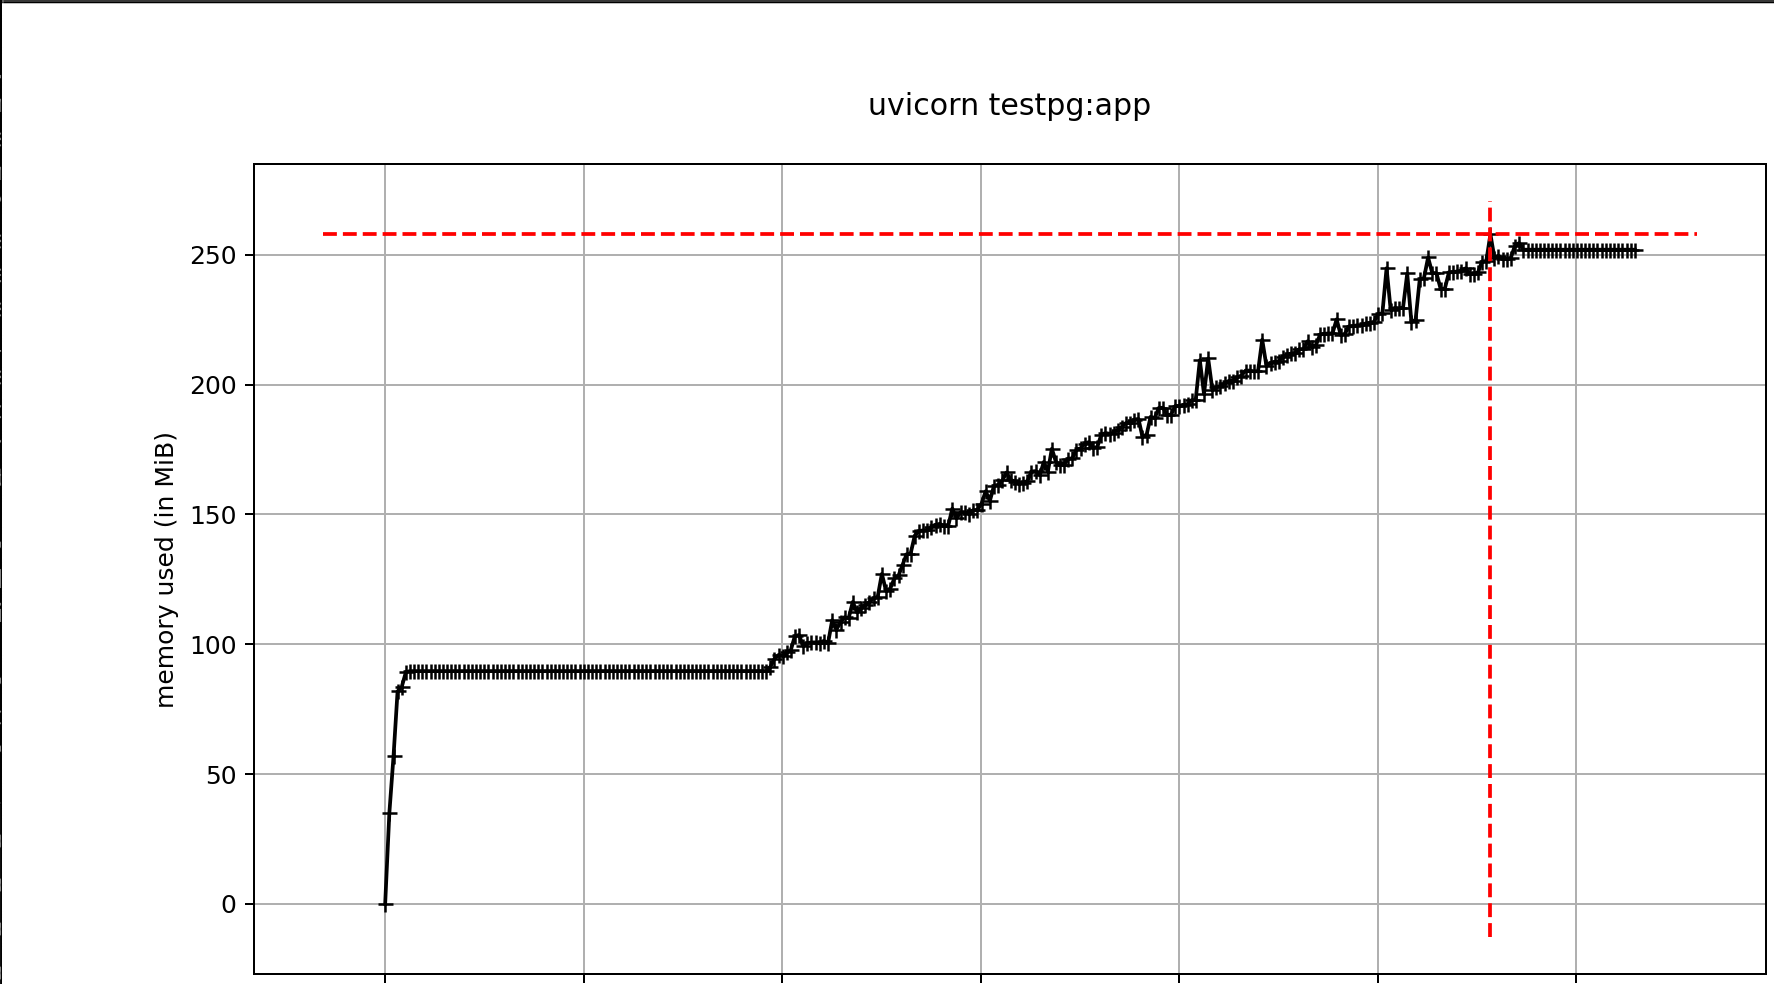
So far, so good. About a week ago, we discovered that the allocated working memory in our backend is increasing day by day. So we went in search of where this was coming from and discovered that it was due to the database calls that we make with the AsyncIOMotorCollection. We found out, that not the whole memory, that is allocated on a read or write operation, is again released afterwards.
For a better understanding of the problem, I have made an example application with which the whole thing can be reproduced (I have attached it here). This is a simple CRUD-application in the approximate structure of our project. For sure, some functions would not be necessary in this simple example, but they are in our project. In order to build it as close as possible to our original, I have done the same here.
In this example application, we use the "memory-profiler" library to find out the places that allocate memory. This is done line by line, which allows us to narrow it down to the calls of the AsyncIOMotorCollection. Now how can this be reproduced:
In the project you can find a docker-compose.yml to start a MongoDB instance with docker. Afterwards you can install all libraries using poetry and start the application with the memory-profiler using "poetry run python -m memory_profiler main.py".
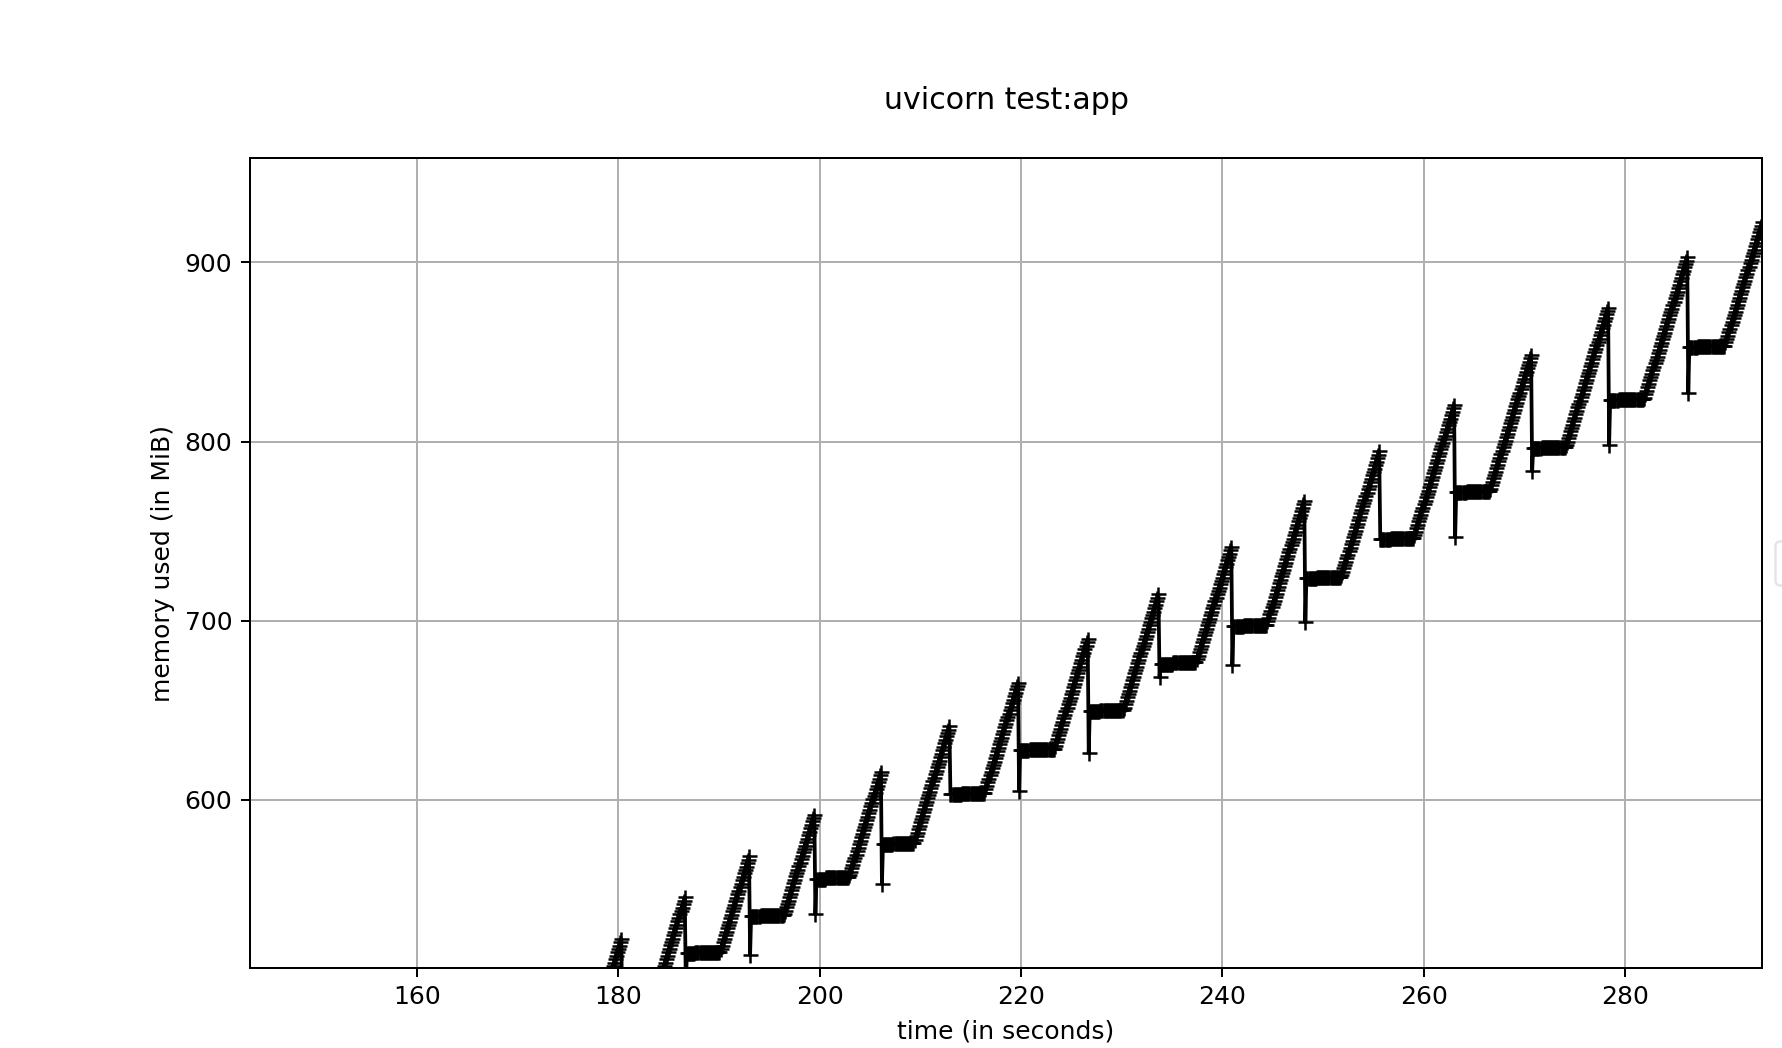
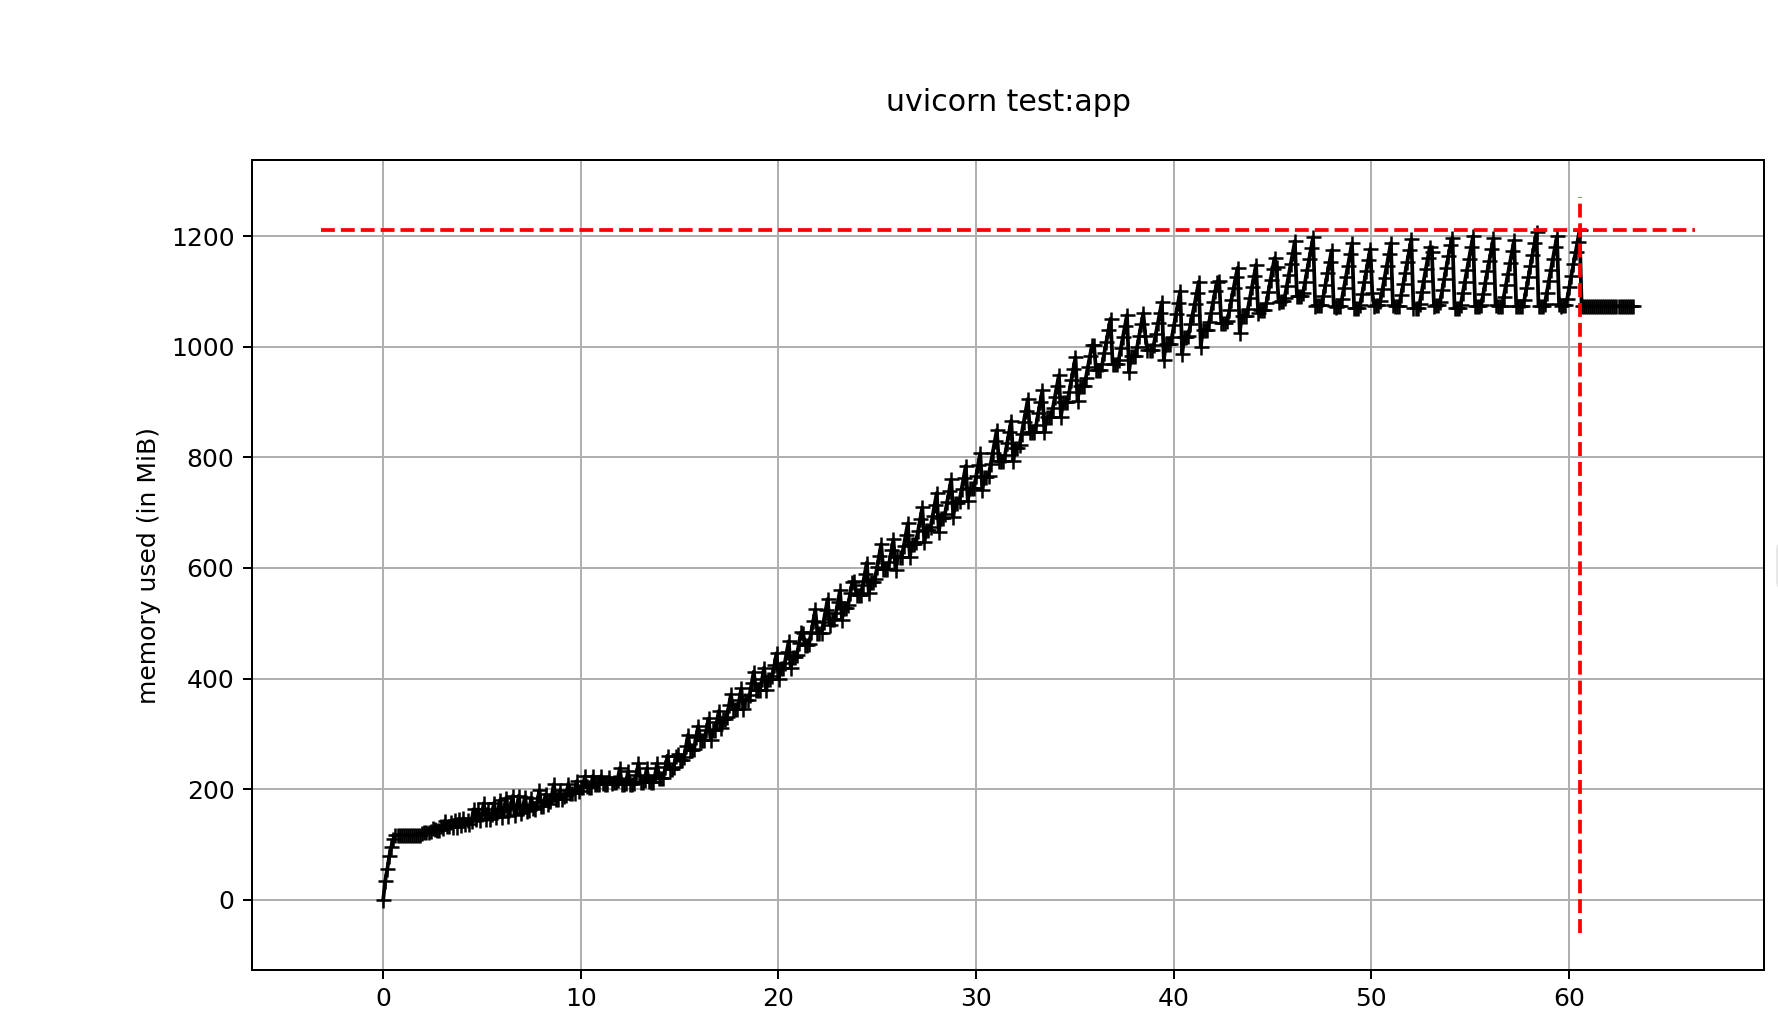
In the project you can find six json-files, that can be used to add data to the DB over the POST-endpoint. After doing that, restart the application and do a list GET. When you're doing this, you will see the output of the profiler in the console: The memory starts at the start of the function-call at value "x" and increases on the database-call to value "y". When you do the request again, the memory usage is already higher than "x" at the beginning and increases again on the database-call to value "y". When you repeat this often enough you come to the point, where the starting memory usage of the call is already "y" with no increase on the database call. So it seams to get stable with the trade-off, that a permanent memory-increase was done.
When you then add another item to the DB over the POST endpoint and do then a list GET again, you can observer the same behaviour as described before: The memory allocation is increasing from call to call leading in a infinite memory allocation increase over the runtime of the application.
Now the question: Where does this come from and is this a bug? And how can it be fixed?
Thanks a lot for the help!
Andreas ![]()
- is related to
-
PYTHON-3982 Investigate possible memory leak
-
- Closed
-
-
-

- Closed
-