-
Type:
Improvement
-
Resolution: Unresolved
-
Priority:
 Major - P3
-
None
-
Affects Version/s: 2.6.1
-
Component/s: Aggregation Framework
-
Query Optimization
-
None
-
None
-
None
-
None
-
None
-
None
-
None
Currently the DocumentSourceUnwind::getDependencies() method assumes that we need the whole array referenced by the $unwind, including all subfields. This is actually necessary to handle specific edge cases, such as when an array looks like [{subfield: 1, unneeded: "something large and expensive"}, "Not an object"]. In the current encoding scheme used by our dependency analyzer, if we were to depend on just "array.subfield", the $unwind would emit only 1 document from that array rather than the currently specified 2. While that wouldn't effect the outcome of all $groups, it would for groups with a {count: {$sum: 1}} clause in them. We can handle this correctly with a better encoding of dependencies in our analysis pass that would note that we depend on the exact length of the array, but only a subset of its contents.
If we add some way to encode that we only need the length of the array, $size should also use this.
Original description:
A thread for this issue has already been started in SERVER-13703. Since it was not related anymore to the original issue of SERVER-13703, I open this new issue.
I have a collection that contains 10000 documents. Each document looks like the following:
{
 "_id" : NumberLong(1),
  "NonIndexedField" : NumberLong(1),
  "DateTime" : ISODate("2014-06-02T19:59:09.836Z"),
  "Field1" : "72eda069-1737-4db6-9367-8399ebdc0f8e",
  "Field2" : "2e72ccdc-0e40-49b8-9d13-2b74855fd938",
  "Field3" : "29e1caad-355e-4351-9d4b-f160225f41b3",
  "Field4" : "ef6083c5-b919-411b-b942-d984b050d91f",
  "Field5" : "39437c80-7423-4c50-b06f-59018b0437f5",
  "Field6" : "35d2301f-cb96-4392-9084-ff057142f35b",
  "ChildrenLevel1" : [a fairly big array]
}
Each document is on average 512 kB big. So, it means that ChildrenLevel1 is quite a big array. In fact it contains only 10 elements but each of these elements contain a lot of other elements, sub arrays, etc.
If I try to find the max value of a top level field using the aggregation framework, it takes virtually 0ms. Here is the query that I use:
db.Demo.aggregate([
	 {$group: {
	           _id : 0,
	           max : {$max : "$DateTime"}
	          }
	 }
	])
If I try to do the same thing on a date that is within the ChildrenLevel1 array, it now takes 36 seconds at the minimal. The first time that I ran the query it took even longer since data was not in RAM. On the subsequent call, it took 36s. This makes for an average of 3.6 milliseconds per document. IMHO, this is quite long. Here is the query:
db.Demo.aggregate([
	 {$unwind: "$ChildrenLevel1"},
	 {$group: {
	           _id : 0,
	           max : {$max : "$ChildrenLevel1.DateTime"}
	          }
	 }
	])
I created a backup of my test database. This backup can be provided if you want, but I have to say that it is somewhat big. The compressed backup is about 1GB big. Instead of transferring this big backup, I can provide a little Windows command line executable that can be used to create the database.
What was interesting while creating the backup was to see how fast the operation was:
d:\MongoDb\bin>mongodump.exe --db MongoProjectPerformanceProblem --out d:\MongoDb\PerfProblem.direct.backup --dbpath d:\MongoDb\Data
2014-08-27T06:23:07.916-0400 DATABASE: MongoProjectPerformanceProblem    to     d:\MongoDb\PerfProblem.direct.backup\MongoProjectPerformanceProblem
2014-08-27T06:23:08.181-0400 [tools] query MongoProjectPerformanceProblem.system.indexes planSummary: COLLSCAN ntoreturn:0 ntoskip:0 nscanned:1 nscannedObjects:1 keyUpdates:0 numYields:0 locks(micros)
 W:50769 r:199372 nreturned:1 reslen:110 108ms
2014-08-27T06:23:08.181-0400    MongoProjectPerformanceProblem.system.indexes to d:\MongoDb\PerfProblem.direct.backup\MongoProjectPerformanceProblem\system.indexes.bson
2014-08-27T06:23:08.181-0400             1 documents
2014-08-27T06:23:08.181-0400    MongoProjectPerformanceProblem.Demo to d:\MongoDb\PerfProblem.direct.backup\MongoProjectPerformanceProblem\Demo.bson
2014-08-27T06:23:09.834-0400 [tools] warning Listener::getElapsedTimeMillis returning 0ms
2014-08-27T06:23:11.004-0400 [tools]            Collection File Writing Progress: 3900/10000    39% (documents)
2014-08-27T06:23:11.114-0400 [tools] warning Listener::getElapsedTimeMillis returning 0ms
2014-08-27T06:23:12.486-0400 [tools] warning Listener::getElapsedTimeMillis returning 0ms
2014-08-27T06:23:13.875-0400 [tools] warning Listener::getElapsedTimeMillis returning 0ms
2014-08-27T06:23:14.000-0400 [tools]            Collection File Writing Progress: 8300/10000    83% (documents)
2014-08-27T06:23:15.029-0400             10000 documents
2014-08-27T06:23:15.513-0400    Metadata for MongoProjectPerformanceProblem.Demo to d:\MongoDb\PerfProblem.direct.backup\MongoProjectPerformanceProblem\Demo.metadata.json
2014-08-27T06:23:15.528-0400 [tools] dbexit:
2014-08-27T06:23:15.528-0400 [tools] shutdown: going to close listening sockets...
2014-08-27T06:23:15.528-0400 [tools] shutdown: going to flush diaglog...
2014-08-27T06:23:15.528-0400 [tools] shutdown: going to close sockets...
2014-08-27T06:23:15.528-0400 [tools] shutdown: waiting for fs preallocator...
2014-08-27T06:23:15.528-0400 [tools] shutdown: closing all files...
2014-08-27T06:23:15.981-0400 [tools] closeAllFiles() finished
2014-08-27T06:23:15.981-0400 [tools] shutdown: removing fs lock...
2014-08-27T06:23:15.981-0400 [tools] dbexit: really exiting now
As you can see, it took only about 8 seconds. So, reading the whole database from disk and then writing it to disk was 4.5 times faster than processing with the aggregation framework the same amount of data... and this data was already loaded in RAM. Can you please confirm that you think like me that the aggregation framework query should be much faster than the backup operation?
Note that all these tests were made on a machine that has lots of available memory. After my tests, there was still about 30 GB of unused RAM.
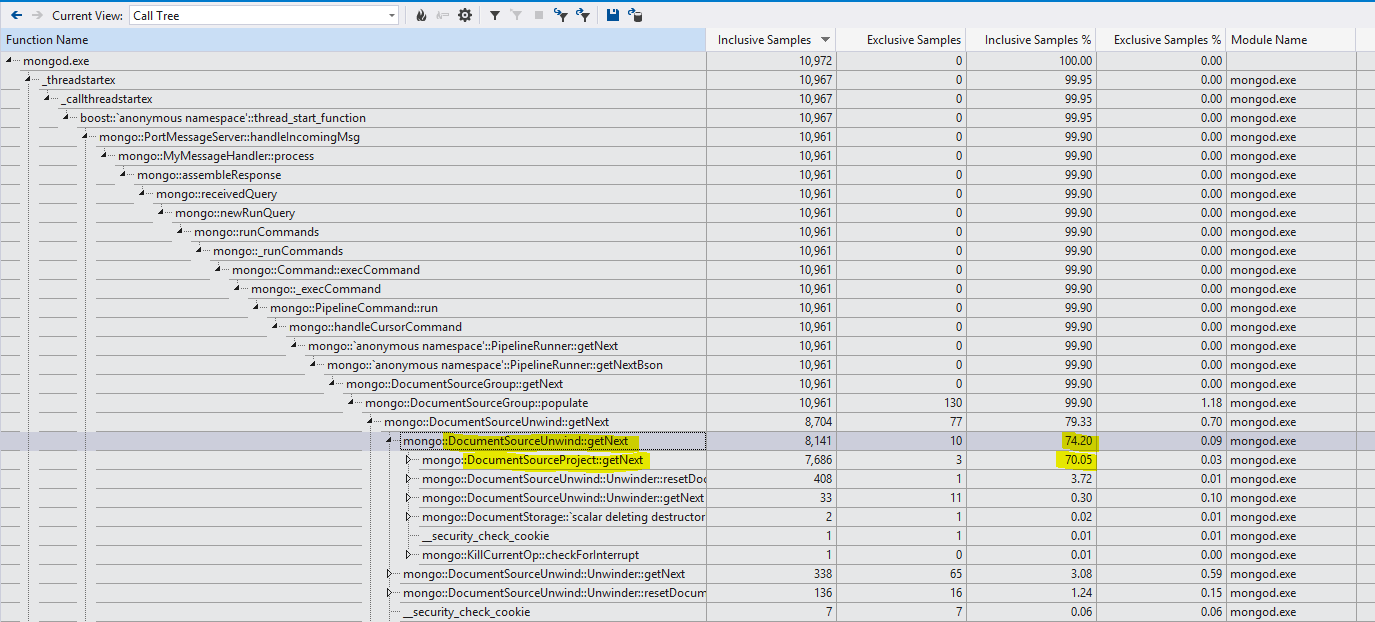
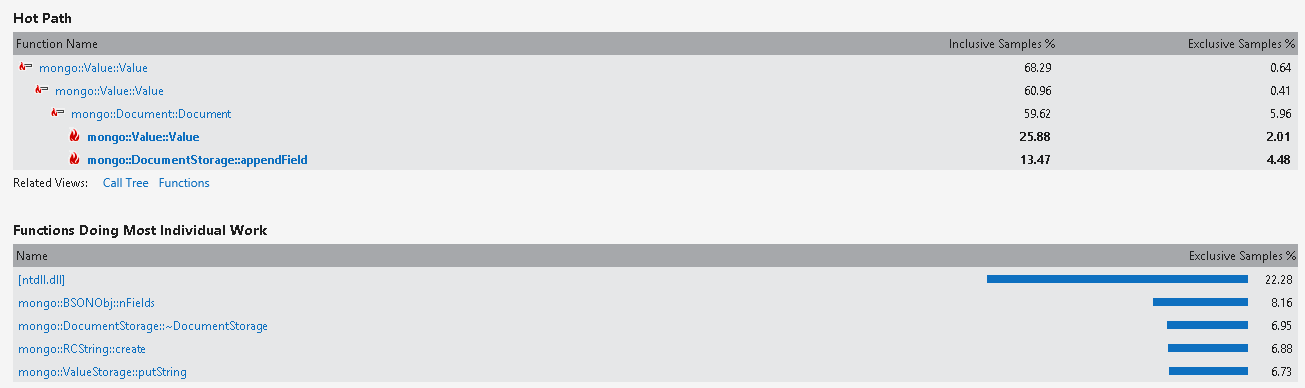
I have the feeling (I may be TOTALLY wrong here) that the aggregation framework copies the BSON documents contained in Mongo's memory map file into a set of new objects and that this is the cause of the performance degradation. Copying the object may not be as efficient as it can be. Can you confirm if I am wrong or right? I did a quick profiling of the source code and found out that a lot of the time was spent around the following code:
case Array: {
   intrusive_ptr<RCVector> vec (new RCVector);
   BSONForEach(sub, elem.embeddedObject()) {
       vec->vec.push_back(Value(sub));
   }
   _storage.putVector(vec.get());
   break;
}
Note that I would really like to contribute to resolving this issue. I am opened for discussion and/or to contribute on Mongo's source code. I really need this issue to be fixed because it is blocking us to go forward in dropping the costly SQL Server Enterprise + a Microsoft OLAP Cube. I really believe that Mongo's aggregation framework coupled with the memory mapped file can really compete (and probably win) against our current DataWarehouse and Cube.