Uploaded image for project: 'Core Server'
  1. Core Server
  2. SERVER-17838

Find operations slow down over time as results of heap contention under stress

    • Type: Icon: Bug Bug
    • Resolution: Incomplete
    • Priority: Icon: Major - P3 Major - P3
    • None
    • Affects Version/s: None
    • Component/s: Querying
    • Labels:
    • ALL

      Environment:
      771f17-2015-03-30\bin>mongo.exe --version
      MongoDB shell version: 3.0.2-pre-

      Stand alone Mongod, configured on Windows

      Test:

      • Hammer.Mongo - query only profile

      Expected - Steady state throughput.
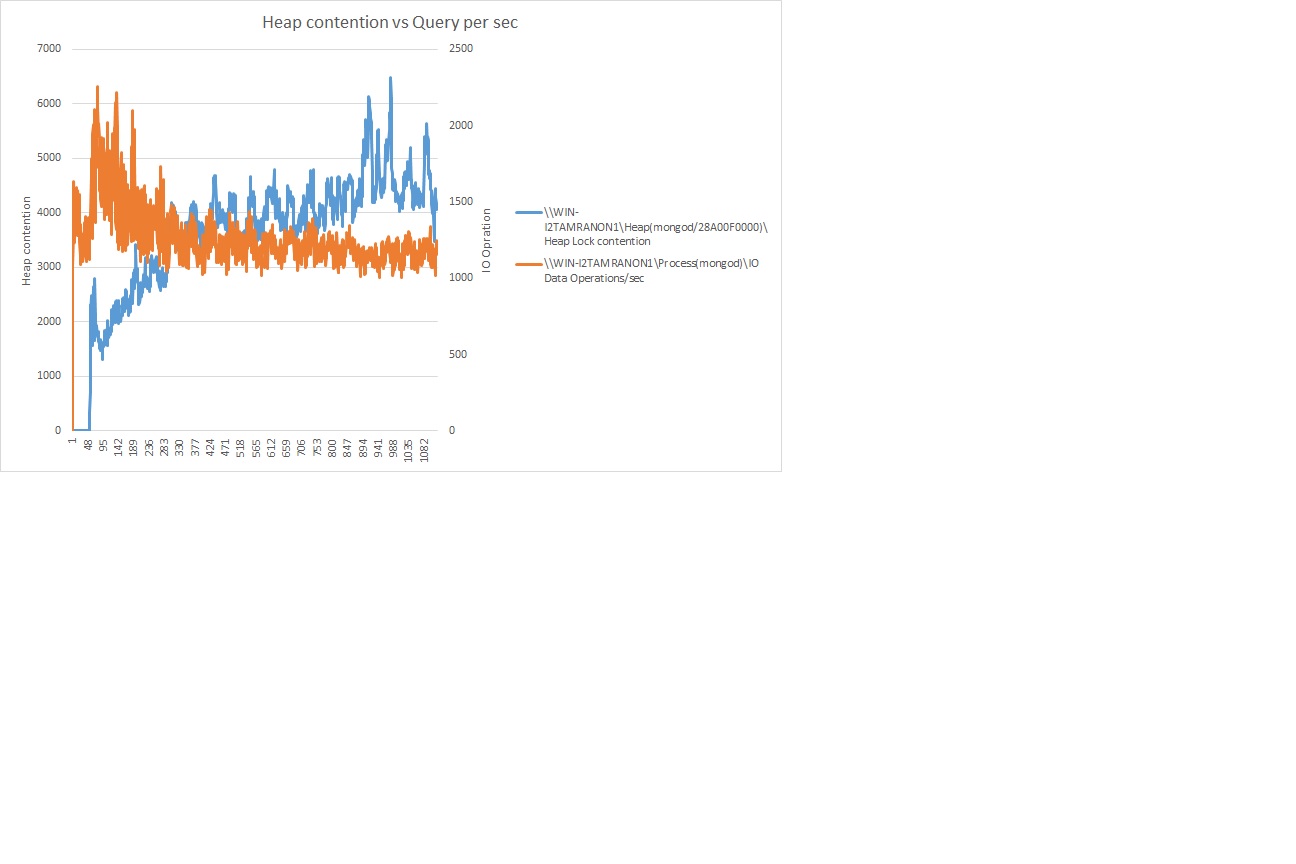
      Actual - Throughput slow down, more parallel query lower throughput

      1. See attached graph that highlight contention vs. I/O operation per sec
      2. Profiler output highlight the malloc/free as hot function

        1. heapContention.jpg
          heapContention.jpg
          81 kB
        2. ProfilerHeap.png
          ProfilerHeap.png
          205 kB

            Assignee:
            eitan.klein Eitan Klein
            Reporter:
            eitan.klein Eitan Klein
            Votes:
            0 Vote for this issue
            Watchers:
            8 Start watching this issue

              Created:
              Updated:
              Resolved: