-
Type:
Bug
-
Resolution: Incomplete
-
Priority:
 Major - P3
-
None
-
Affects Version/s: 3.0.8
-
Component/s: WiredTiger
-
None
-
ALL
-
None
-
None
-
None
-
None
-
None
-
None
-
None
Hi,
We had an issue yesterday on one of our cluster composed to three shards (1 primary / 2 secondaries / 2 arbiters).
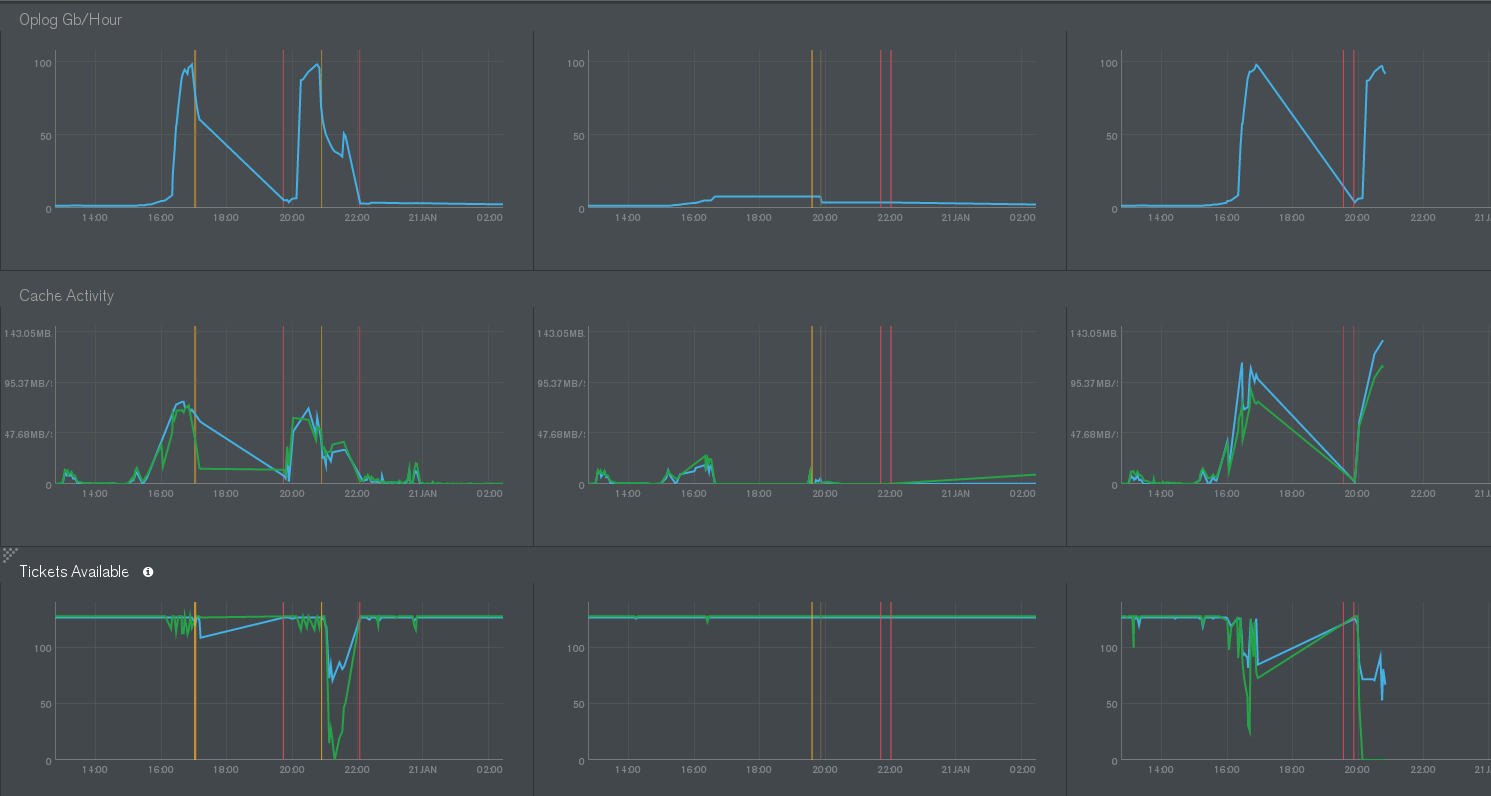
MMS show oplog data increased very fast, up to 100gb per hour in only few minutes. All members crashed (OOM), and the shard became unavailable.
When we tried to restart one instance, it took more than hour, logs only showing :
2016-01-20T20:44:08.609+0000 I CONTROL  ***** SERVER RESTARTED *****
2016-01-20T20:44:08.615+0000 I CONTROL  [initandlisten] MongoDB starting : pid=1 port=27017 dbpath=/data/mongo 64-bit host=db2
2016-01-20T20:44:08.615+0000 I CONTROL  [initandlisten] db version v3.0.8
2016-01-20T20:44:08.615+0000 I CONTROL  [initandlisten] git version: 83d8cc25e00e42856924d84e220fbe4a839e605d
2016-01-20T20:44:08.615+0000 I CONTROL  [initandlisten] build info: Linux ip-10-187-89-126 3.13.0-24-generic #46-Ubuntu SMP Thu Apr 10 19:11:08 UTC 2014 x86_64 BOOST_LIB_VERSION=1_49
2016-01-20T20:44:08.615+0000 I CONTROL  [initandlisten] allocator: tcmalloc
2016-01-20T20:44:08.615+0000 I CONTROL  [initandlisten] options: { config: "/etc/mongodb.conf", net: { port: 27017 }, processManagement: { pidFilePath: "/var/run/mongodb.pid" }, replication: { replSet: "rs2" }, storage: { dbPath: "/data/mongo", engine: "wiredTiger", wiredTiger: { collectionConfig: { blockCompressor: "zlib" }, engineConfig: { cacheSizeGB: 80 } } }, systemLog: { destination: "file", logAppend: true, path: "/var/log/mongodb/mongo.log" } }
2016-01-20T20:44:08.630+0000 W -        [initandlisten] Detected unclean shutdown - /data/mongo/mongod.lock is not empty.
2016-01-20T20:44:08.630+0000 W STORAGE  [initandlisten] Recovering data from the last clean checkpoint.
2016-01-20T20:44:08.630+0000 I STORAGE  [initandlisten] wiredtiger_open config: create,cache_size=80G,session_max=20000,eviction=(threads_max=4),statistics=(fast),log=(enabled=true,archive=true,path=journal,compressor=snappy),file_manager=(close_idle_time=100000),checkpoint=(wait=60,log_size=2GB),statistics_log=(wait=0),
After more than hour at this step, we saw two things :
- Files in the datapath were changed, so something was happening (process wasn't stuck or crashed)
- Journal directory was larger than the database :
 # du -sh *
16K	collection-0-7362315326558577998.wt
36K	collection-2-7362315326558577998.wt
36K	collection-4-7362315326558577998.wt
102G	collection-5-2339093620230170406.wt
88G	collection-6-7362315326558577998.wt
36K	collection-7-7362315326558577998.wt
16K	index-1-7362315326558577998.wt
36K	index-3-7362315326558577998.wt
16K	index-5-7362315326558577998.wt
210M	index-6-2339093620230170406.wt
233M	index-7-2339093620230170406.wt
16K	index-8-7362315326558577998.wt
121G	journal
36K	_mdb_catalog.wt
4.0K	mongod.lock
92G	moveChunk
40K	sizeStorer.wt
4.0K	storage.bson
4.0K	WiredTiger
4.0K	WiredTiger.basecfg
4.0K	WiredTiger.lock
4.0K	WiredTiger.turtle
68K	WiredTiger.wt
Because we don't know how many times the instances will took to start, we copied all the data directory and removed journal files. Then the instance started correctly and cluster were available again.
So, here are my questions :
- We don't find any event in our app which can explain why oplog increased like that. Is there a known issue about that ? Maybe in sharding processes ?
- As we keep a backup of datadir, before dropping the journal files, is there any way to open/analyze journal, to find what kind of event are inside and find the root cause of our issue ?
Regards,
Anthony