-
Type:
Bug
-
Resolution: Duplicate
-
Priority:
 Critical - P2
-
None
-
Affects Version/s: 3.0.9
-
Component/s: Replication
-
None
-
Environment:Amazon Linux
-
Linux
-
None
-
None
-
None
-
None
-
None
-
None
-
None
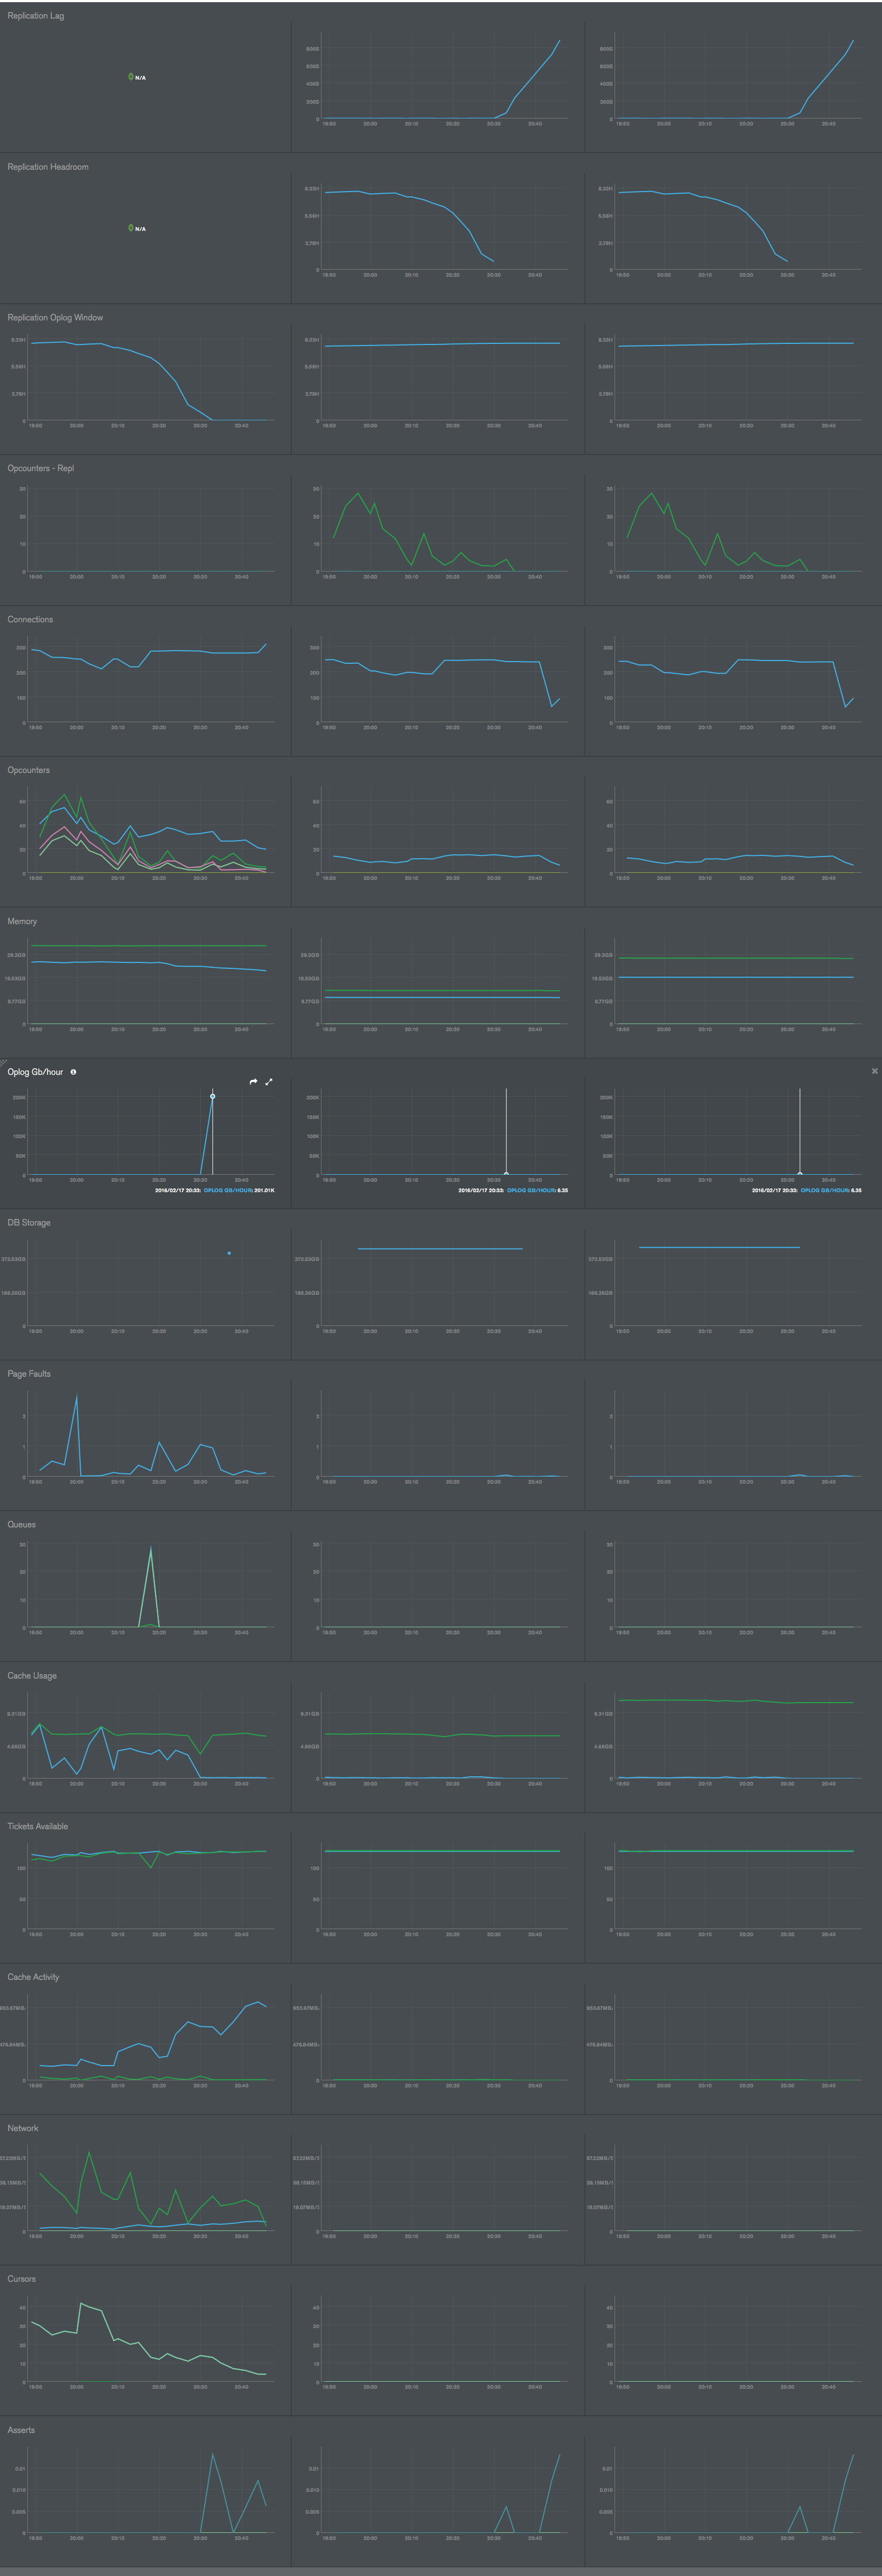
Sudden (huge) spike in Oplog GB/hour on primary member rendered secondaries in "RECOVERY" state. There was no spike in Opcounters, so no idea what went wrong there. Since it's a production db, I wasn't able to wait to collect more information about the issue.
I have added the relevant MMS graphs. Notice the "Oplog GB/hour". First one is primary member, others are secondaries - all running v3.0.9 WiredTiger.
- duplicates
-
-
- Closed
-