-
Type:
Bug
-
Resolution: Done
-
Priority:
 Major - P3
-
Affects Version/s: 3.2.3
-
Component/s: WiredTiger
- single-node replicat set, 3 GB cache, 20 GB oplog
- insert 10 M x 1 kB documents (10 GB total size, plus index)
- then 100 threads querying documents at random, observe low query rate
- then restart mongod, same queries are now much faster
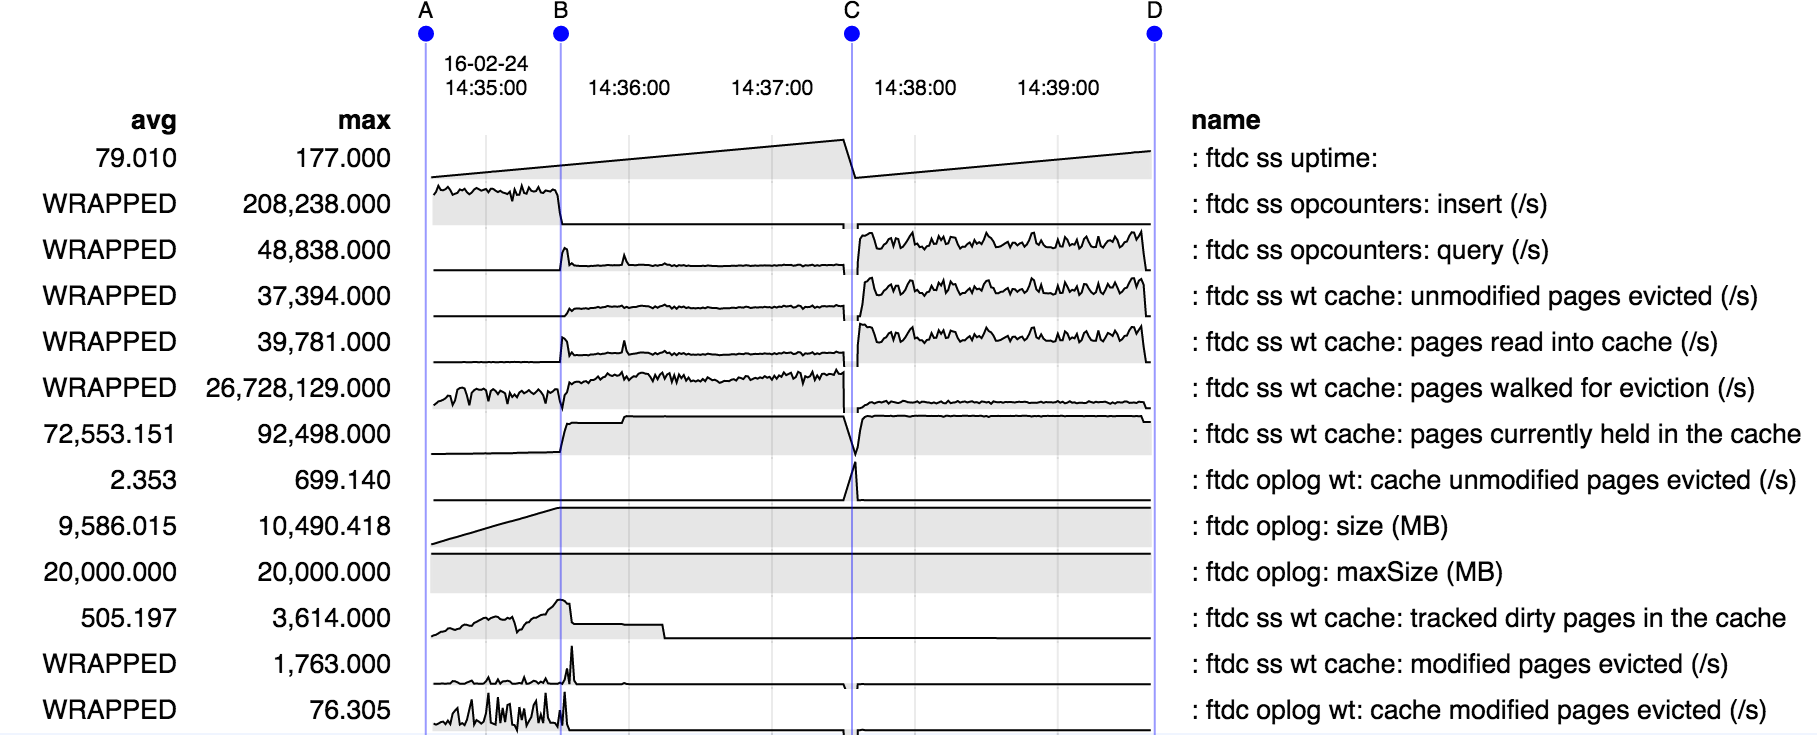
- A-B: collection is being created
- B-C: random queries
- query rate is very low, ~6 k/s
- rate of evicting from and reading into cache is ~9 k pages/s, ~1.5 pages per query, so very high miss ratio
- rate of pages walked for eviction is very high, ~21 M/s, so about 2300 pages walked for every page evicted, or 2-3% of pages in cache walked for every page evicted
- no pages are being evicted from oplog, but it is uncertain whether that is because all pages have already been evicted
- C-D: after restart
- query rate is much higher, ~34 k/s
- rate of evicting from and reading into cache is 26 k pages/s, ~0.75 pages per query, so lower miss ratio than before restart
- rate of pages walked for eviction is much lower
The issue does not reproduce on a standalone node.
Possibly related to SERVER-22423?

- is duplicated by
-
-
- Closed
-
- related to
-
-
- Closed
-
-
-
- Closed
-