-
Type:
Bug
-
Resolution: Duplicate
-
Priority:
 Major - P3
-
None
-
Affects Version/s: 3.2.3
-
Component/s: WiredTiger
-
None
-
ALL
-
(copied to CRM)
-
None
-
None
-
None
-
None
-
None
-
None
-
None
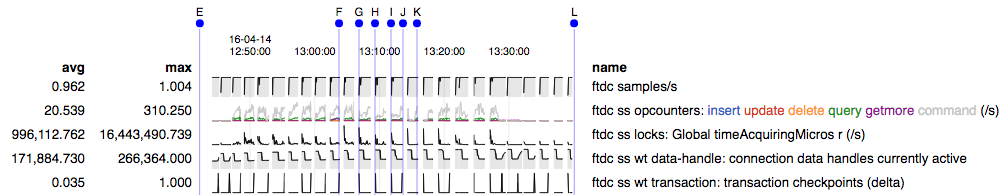
I'm seeing a number of queries that are experiencing very high execution times, almost entirely due to timeAcquiringMicros against the Global Intent Shared lock.
Some examples of the entries from the logs (server, db and collection names anonymised):
Mar 30 15:17:33 SERVER mongod.27017[1461]: [conn2254368] command DB.COLLECTION command: count { count: "requestsByUserState", query: { timeGroup: "2016-03-24" } } planSummary: COUNT_SCAN { timeGroup: -1 } keyUpdates:0 writeConflicts:0 numYields:0 reslen:62 locks:{ Global: { acquireCount: { r: 2 }, acquireWaitCount: { r: 1 }, timeAcquiringMicros: { r: 32914737 } }, Database: { acquireCount: { r: 1 } }, Collection: { acquireCount: { r: 1 } } } protocol:op_query 32915ms

Mar 30 15:25:06 SERVER mongod.27017[1461]: [conn1899344] command DB.COLLECTION command: aggregate { aggregate: "scriptLogLevelsCount.DAILY", pipeline: [ { $match: { _id: { $gte: "2016-03-30", $lt: "2016-03-31" } } }, { $group: { _id: null, FATAL: { $sum: "$scriptLogLevelsCount.FATAL" }, ERROR: { $sum: "$scriptLogLevelsCount.ERROR" }, WARN: { $sum: "$scriptLogLevelsCount.WARN" }, INFO: { $sum: "$scriptLogLevelsCount.INFO" }, DEBUG: { $sum: "$scriptLogLevelsCount.DEBUG" } } } ] } keyUpdates:0 writeConflicts:0 numYields:1 reslen:138 locks:{ Global: { acquireCount: { r: 8 }, acquireWaitCount: { r: 4 }, timeAcquiringMicros: { r: 125415124 } }, Database: { acquireCount: { r: 4 } }, Collection: { acquireCount: { r: 4 } } } protocol:op_query 125416ms

Mar 30 16:03:07 SERVER mongod.27017[1461]: [conn2261655] command DB.COLLECTION command: getMore { getMore: 266905304107253, collection: "COLLECTION" } cursorid:266905304107253 keyUpdates:0 writeConflicts:0 numYields:36 nreturned:4724 reslen:4195106 locks:{ Global: { acquireCount: { r: 74 }, acquireWaitCount: { r: 8 }, timeAcquiringMicros: { r: 88559517 } }, Database: { acquireCount: { r: 37 } }, Collection: { acquireCount: { r: 37 } } } protocol:op_query 88570ms
We're seeing thousands of these per day, from what I can see always on secondary servers, but in this environment we perform the majority of our queries against the secondaries. (Its an analytics processing platform, so is write-heavy on the master and it doesn't matter if queries are slightly stale)
When the slow queries happen, there are often a number of them clustered together during the same or subsequent seconds, which makes me wonder if this is a WiredTiger checkpoint? There are a lot of databases in this replica set, meaning a significant number of files to checkpoint.
Environment details:
3 node replica set
MongoDB 3.2.3 64-bit
WiredTiger storage engine (default config apart from "directoryForIndexes: true")
Ubuntu 14.04.3 LTS
Azure VMs - Standard DS13 (8 Cores, 56 GB memory)
~5,700 databases
~293,000 WiredTiger data and index files
- duplicates
-
WT-1598 Remove the schema, table locks
-
- Closed
-