-
Type:
Bug
-
Resolution: Duplicate
-
Priority:
 Critical - P2
-
None
-
Affects Version/s: 3.2.3, 3.2.4, 3.2.5
-
Component/s: Internal Code, WiredTiger
-
None
-
Fully Compatible
-
ALL
-
-
None
-
None
-
None
-
None
-
None
-
None
-
None
I am doing performance test with 4-shard(3 members for each replica-set).
There's about 1K~2K Query/second and 500~1500 Update(upsert)/second user requests for each shard.
But some shard(primary) is stuck and can't process user request in 10~24 hours after restart. Once this case happen then user requests are blocked for a few hours or never released. Sometimes they released in 10~30 minutes.
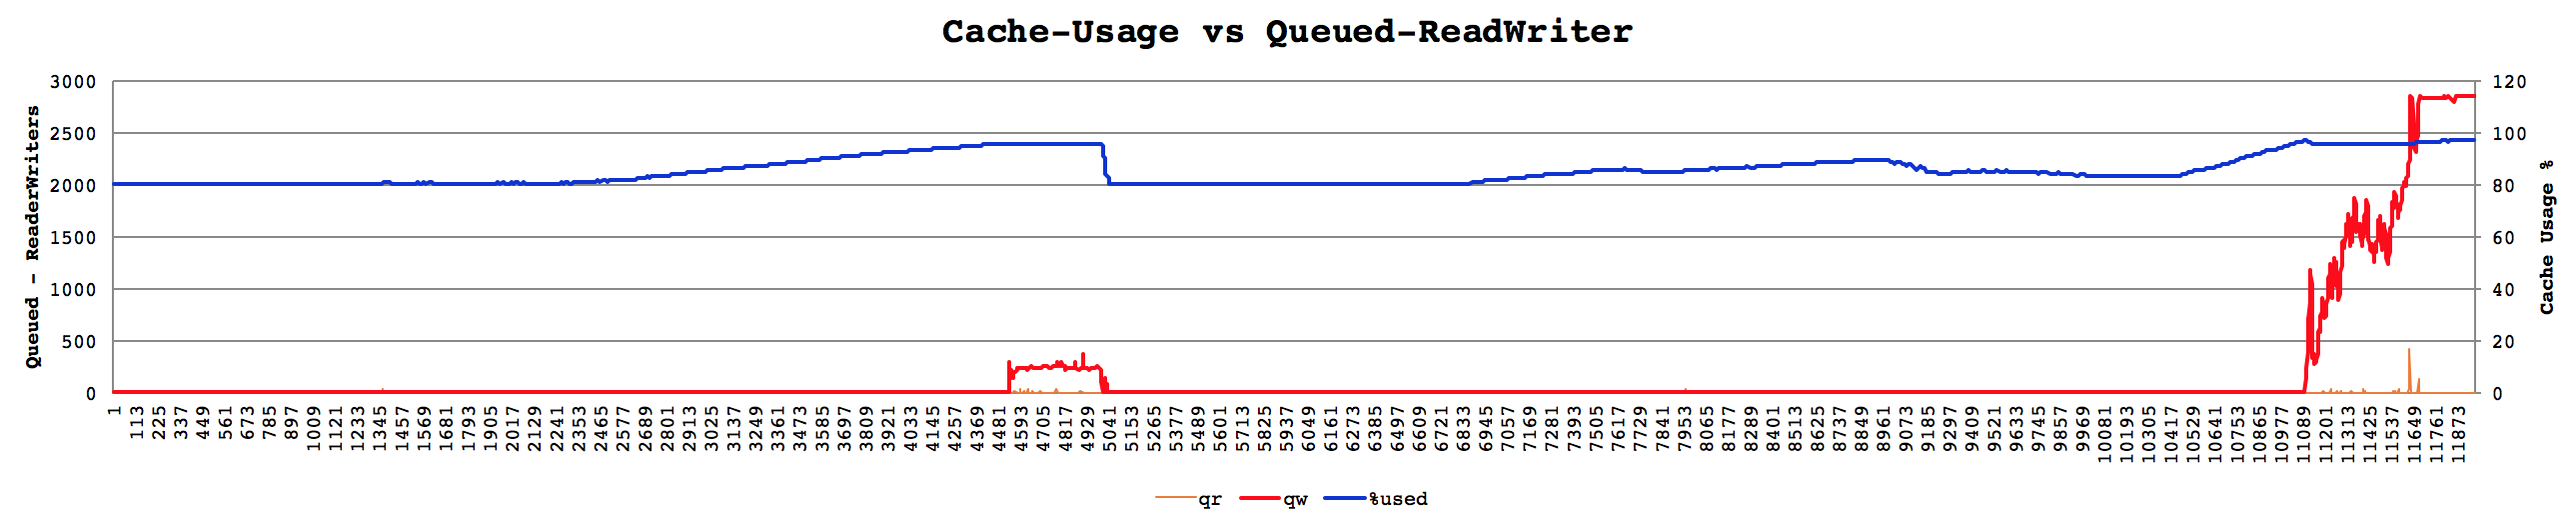
I found this case happens when WiredTiger cache usage is getting over 95%. And during this time, all foreground threads which have "write ticket" are doing __wt_evict() => __wt_txn_update_oldest().
According to checking some wiredtiger source code,
If cache usage is getting over 95%(eviction_trigger), looks like that all eviction server and foreground threads are responsible for LRU eviction. But there's only one thread can update oldest_transaction by global_txn->scan_count. If they can't update then loop finding oldest transaction no again and again.
I am not sure suppressing cache usage with eviction_trigger is planned, But all foreground threads and eviction server starting LRU eviction at the same time might be trouble. (e.g. All ticket holder foreground threads are doing scan all sessions at the same time, and updating oldest transaction is more difficult becuase scan_count is getting high at maximum ticket count).
Usually cache usage is 80% and during this time everything is fine, But once cache usage is getting over 80% increasing usage is not stopped up to 96~97%. after that Queued writer and reader is increasing, and active reader and writers are scanning oldest transaction.
Attached pstack_primary.txt is stack trace of primary when this case happen.
And attached pstack_secondary.txt is stack trace of secondary after primary /secondary switching(stepdown). (Actually pstack_primary.txt and pstack_seconday.txt are stack trace for the same server, just replication role is changed)

- duplicates
-
-

- Closed
-
- is duplicated by
-
-
- Closed
-
- links to