-
Type:
Bug
-
Resolution: Done
-
Priority:
 Major - P3
-
None
-
Affects Version/s: 3.0.11
-
Component/s: WiredTiger
-
None
-
None
-
None
-
None
-
None
-
None
-
None
-
None
Hello All,
The setup
I am running a replica set in production without sharding. All nodes are running latest stable mongo 2.6 except one hidden node which has mongo 3.0 with wiredTiger enabled.
The data
I have around 4TB worth of data on each node (MMAPv1), with close to 7000 databases. The hidden node has 2TB of data because of wiredTiger.
The plan
I decided to upgrade to 3.2 and as an intermediate step, I have to upgrade to 3.0 first. So to start with that, I added the aforementioned hidden member to the existing replica set. I started sending prod like read query traffic to this node to check if it will be able to withstand that much load. I did this for over a week.
The plan was to roll out 3.0 on all secondaries if latencies and rps are close to prod like pattern.
The observation
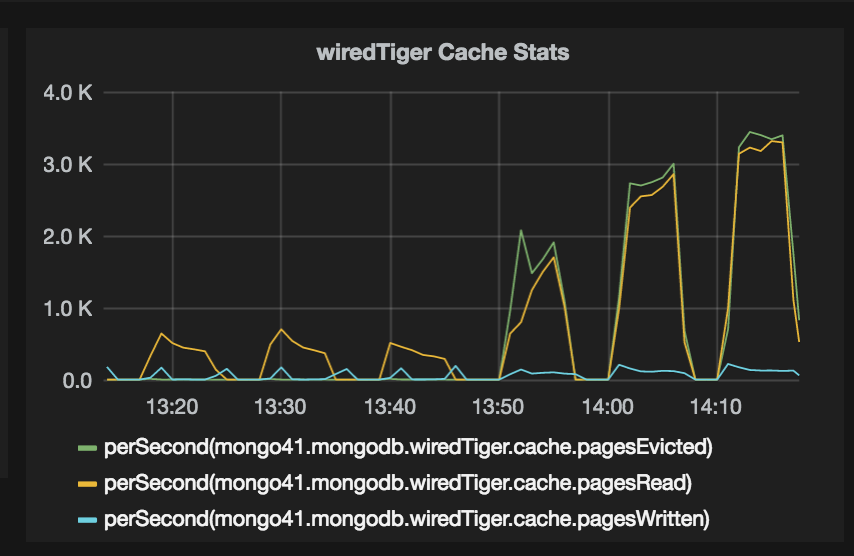
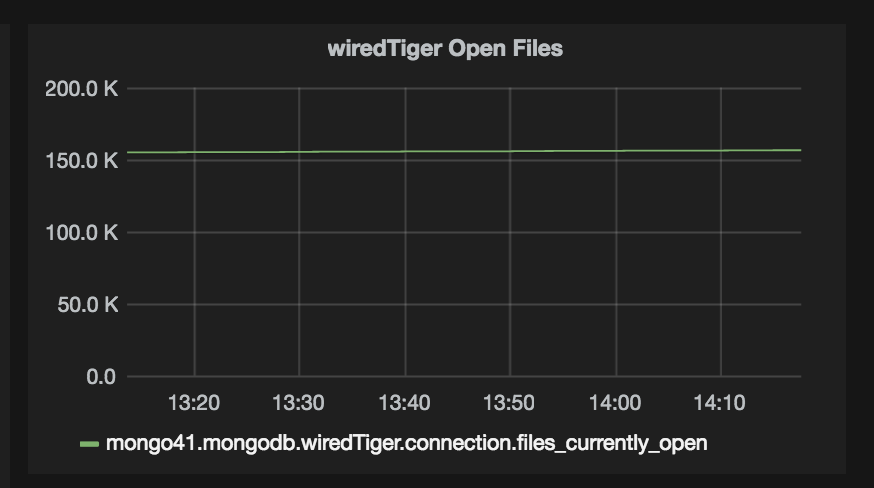
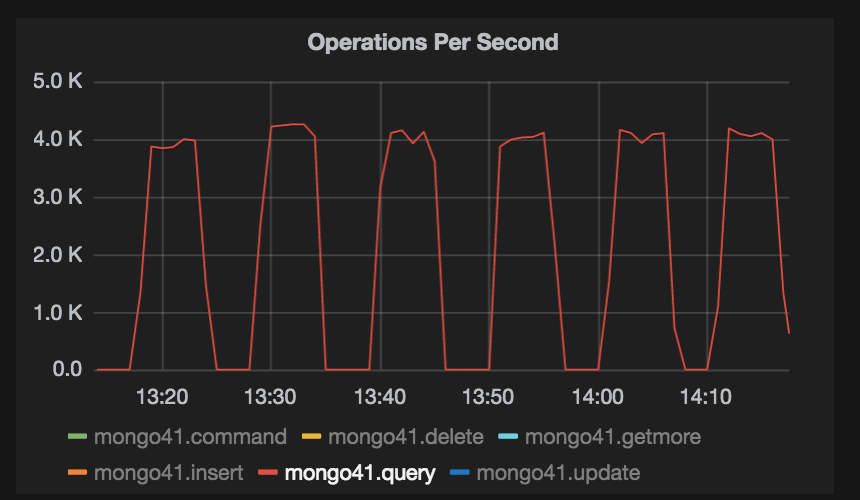
As expected, wiredTiger ended up creating huge number of files, the number is close to 600k, with number of open files at any given time close to 150k. This node could handle upto 4k queries per second, but I saw a drop in traffic, from 4k RPS to 0 (zero) after every 4 to 5 minutes. This behaviour was observed for over a week, consistently. At the same time CPU/Memory/Disk are doing just fine.
In the process of understanding what exactly is happening, I ran db.currentOp() on that node where I found following.
rs01:SECONDARY> db.currentOp({"secs_running" : { $exists: true}})
{
    "inprog" : [
        {
           "desc" : "conn2640",
           "threadId" : "0xa2a763ba0",
           "connectionId" : 2640,
           "opid" : 15958259,
           "active" : true,
           "secs_running" : 255,
           "microsecs_running" : NumberLong(255666599),
           "op" : "query",
           "ns" : "<db_name>.<collection_name>",
           "query" : {
               "$orderby" : { "placeholder" : NumberLong(-1) },
               "$query" : {
                   "placeholder" : { "$in" : [ "placeholder" ] },
                   "placeholder" : "placeholder",
                   "$or" : [
                       {
                         "placeholder" : {
                           "$gt" : ISODate("2016-03-08T05:54:35.977Z")
                         }
                       }
                   ],
                   "placeholder" : "placeholder"
               }
           },
           "client" : "<some_ip>:34210",
           "numYields" : 1,
           "locks" : { "Global" : "r" },
           "waitingForLock" : true,
           "lockStats" : {
               "Global" : {
                   "acquireCount" : { "r" : NumberLong(3) },
                   "acquireWaitCount" : { "r" : NumberLong(1) },
                   "timeAcquiringMicros" : { "r" : NumberLong(255561934) }
               },
               "Database" : { "acquireCount" : { "r" : NumberLong(1) } },
               "Collection" : { "acquireCount" : { "r" : NumberLong(1) } }
           }
        },
        {
           "desc" : "repl writer worker 5",
           "threadId" : "0x15738ca80",
           "opid" : 15958268,
           "active" : true,
           "secs_running" : 255,
           "microsecs_running" : NumberLong(255634829),
           "op" : "none",
           "ns" : "<db_name>.<collection_name>",
           "query" : { },
           "numYields" : 0,
           "locks" : {
                   "Global" : "w",
                   "Database" : "w",
                   "Collection" : "w"
           },
           "waitingForLock" : false,
           "lockStats" : {
              "Global" : { "acquireCount" : { "w" : NumberLong(1) } },
              "Database" : { "acquireCount" : { "w" : NumberLong(1) } },
              "Collection" : { "acquireCount" : { "w" : NumberLong(1) } }
           }
        }
    ]
}
Here you can see two operations are "in progress". First one is a query, which is "waiting for lock" for whopping 255 seconds, whereas another is a "repl writer worker thread", which is again running for 255 seconds and holding Global, Database and Collection level lock with "w" (Intent Exclusive) mode.
From the docs here, https://docs.mongodb.org/v3.0/faq/concurrency/#how-does-concurrency-affect-secondaries I understand that
In replication, MongoDB does not apply writes serially to secondaries. Secondaries collect oplog entries in batches and then apply those batches in parallel. Secondaries do not allow reads while applying the write operations, and apply write operations in the order that they appear in the oplog.
That explains why lock is present, but I am yet to understand why is it taking more than 4 minutes to finish.
I would appreciate if you guide me in the right direction to understand what exactly is happening here.
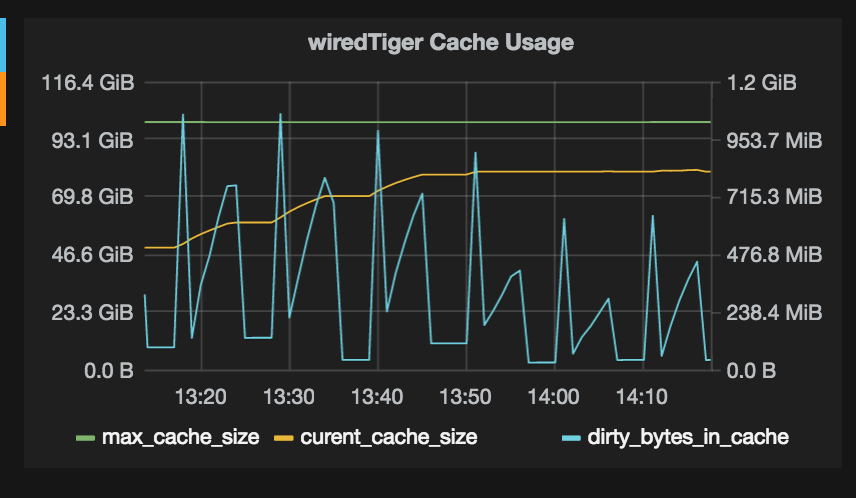
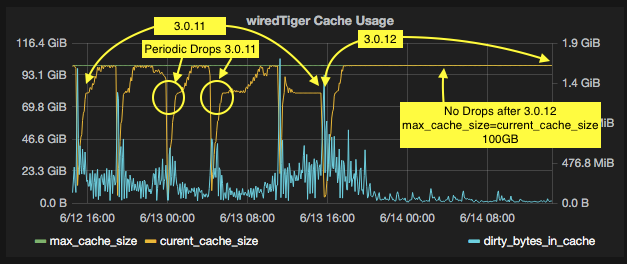
Graphs attached.
- is related to
-
-
- Closed
-