-
Type:
Bug
-
Resolution: Done
-
Priority:
 Major - P3
-
Affects Version/s: 3.0.12
-
Component/s: MMAPv1
-
None
-
Fully Compatible
-
ALL
-
-
Integration 17 (07/15/16), Integration 18 (08/05/16)
-
None
-
None
-
None
-
None
-
None
-
None
-
None
Hi,
I’ve noticed a severe spike in resource utilization leading to degradation in performance on AWS since upgrading to 3.0 as a result of the way the TTLMonitor queries for indexes when using MMAPv1.
In 2.6, TTL indexes were collected by querying the system.indexes collection like so:
                auto_ptr<DBClientCursor> cursor =
                                db.query( dbName + ".system.indexes" ,
                                          BSON( secondsExpireField << BSON( "$exists" << true ) ) ,
                                          0 , /* default nToReturn */
                                          0 , /* default nToSkip */
                                          0 , /* default fieldsToReturn */
                                          QueryOption_SlaveOk ); /* perform on secondaries too */
In 3.0 system.indexes was deprecated and a new abstraction layer between the database and the storage engine was introduced. As a result, namespace file operations are now much less efficient. The issue I am seeing appears to be the result of the following bit of code:
    void iterAll(IteratorCallback callback) {
        for (int i = 0; i < n; i++) {
            if (_nodes(i).inUse()) {
                callback(_nodes(i).key, _nodes(i).value);
            }
        }
    }
which gets executed by the TTLMonitor via this code path:
mongo/db/storage/mmap_v1/catalog/hashtab.h - NamespaceHashTable::iterAll
mongo/db/storage/mmap_v1/catalog/namespace_index.cpp - NamespaceIndex::getCollectionNamespaces
mongo/db/storage/mmap_v1/mmap_v1_database_catalog_entry.cpp - MMAPV1DatabaseCatalogEntry::getCollectionNamespaces
mongo/db/ttl.cpp - TTLMonitor::getTTLIndexesForDB
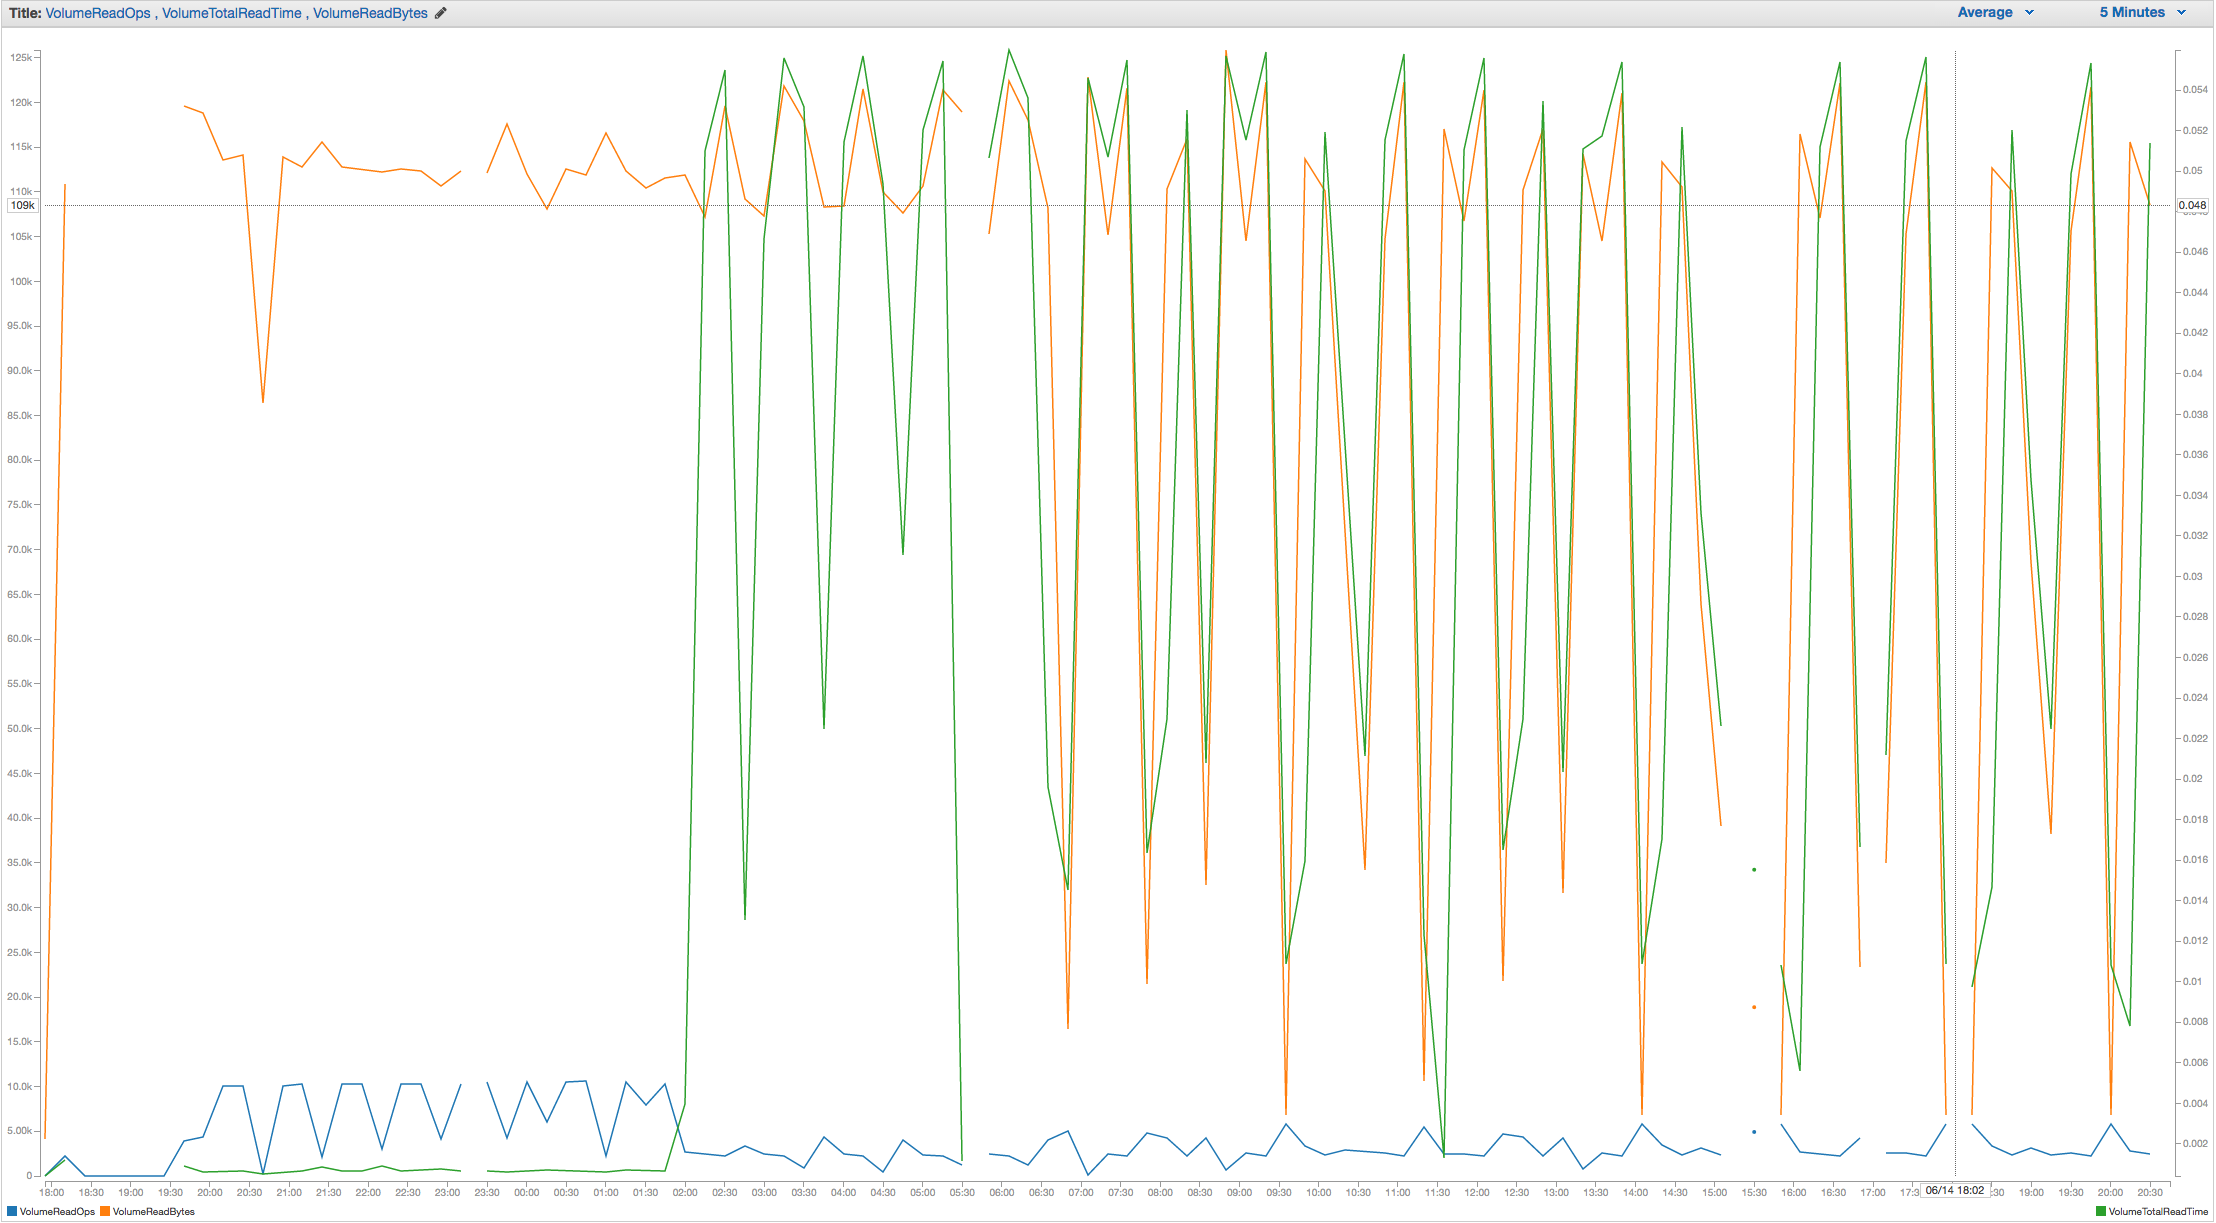
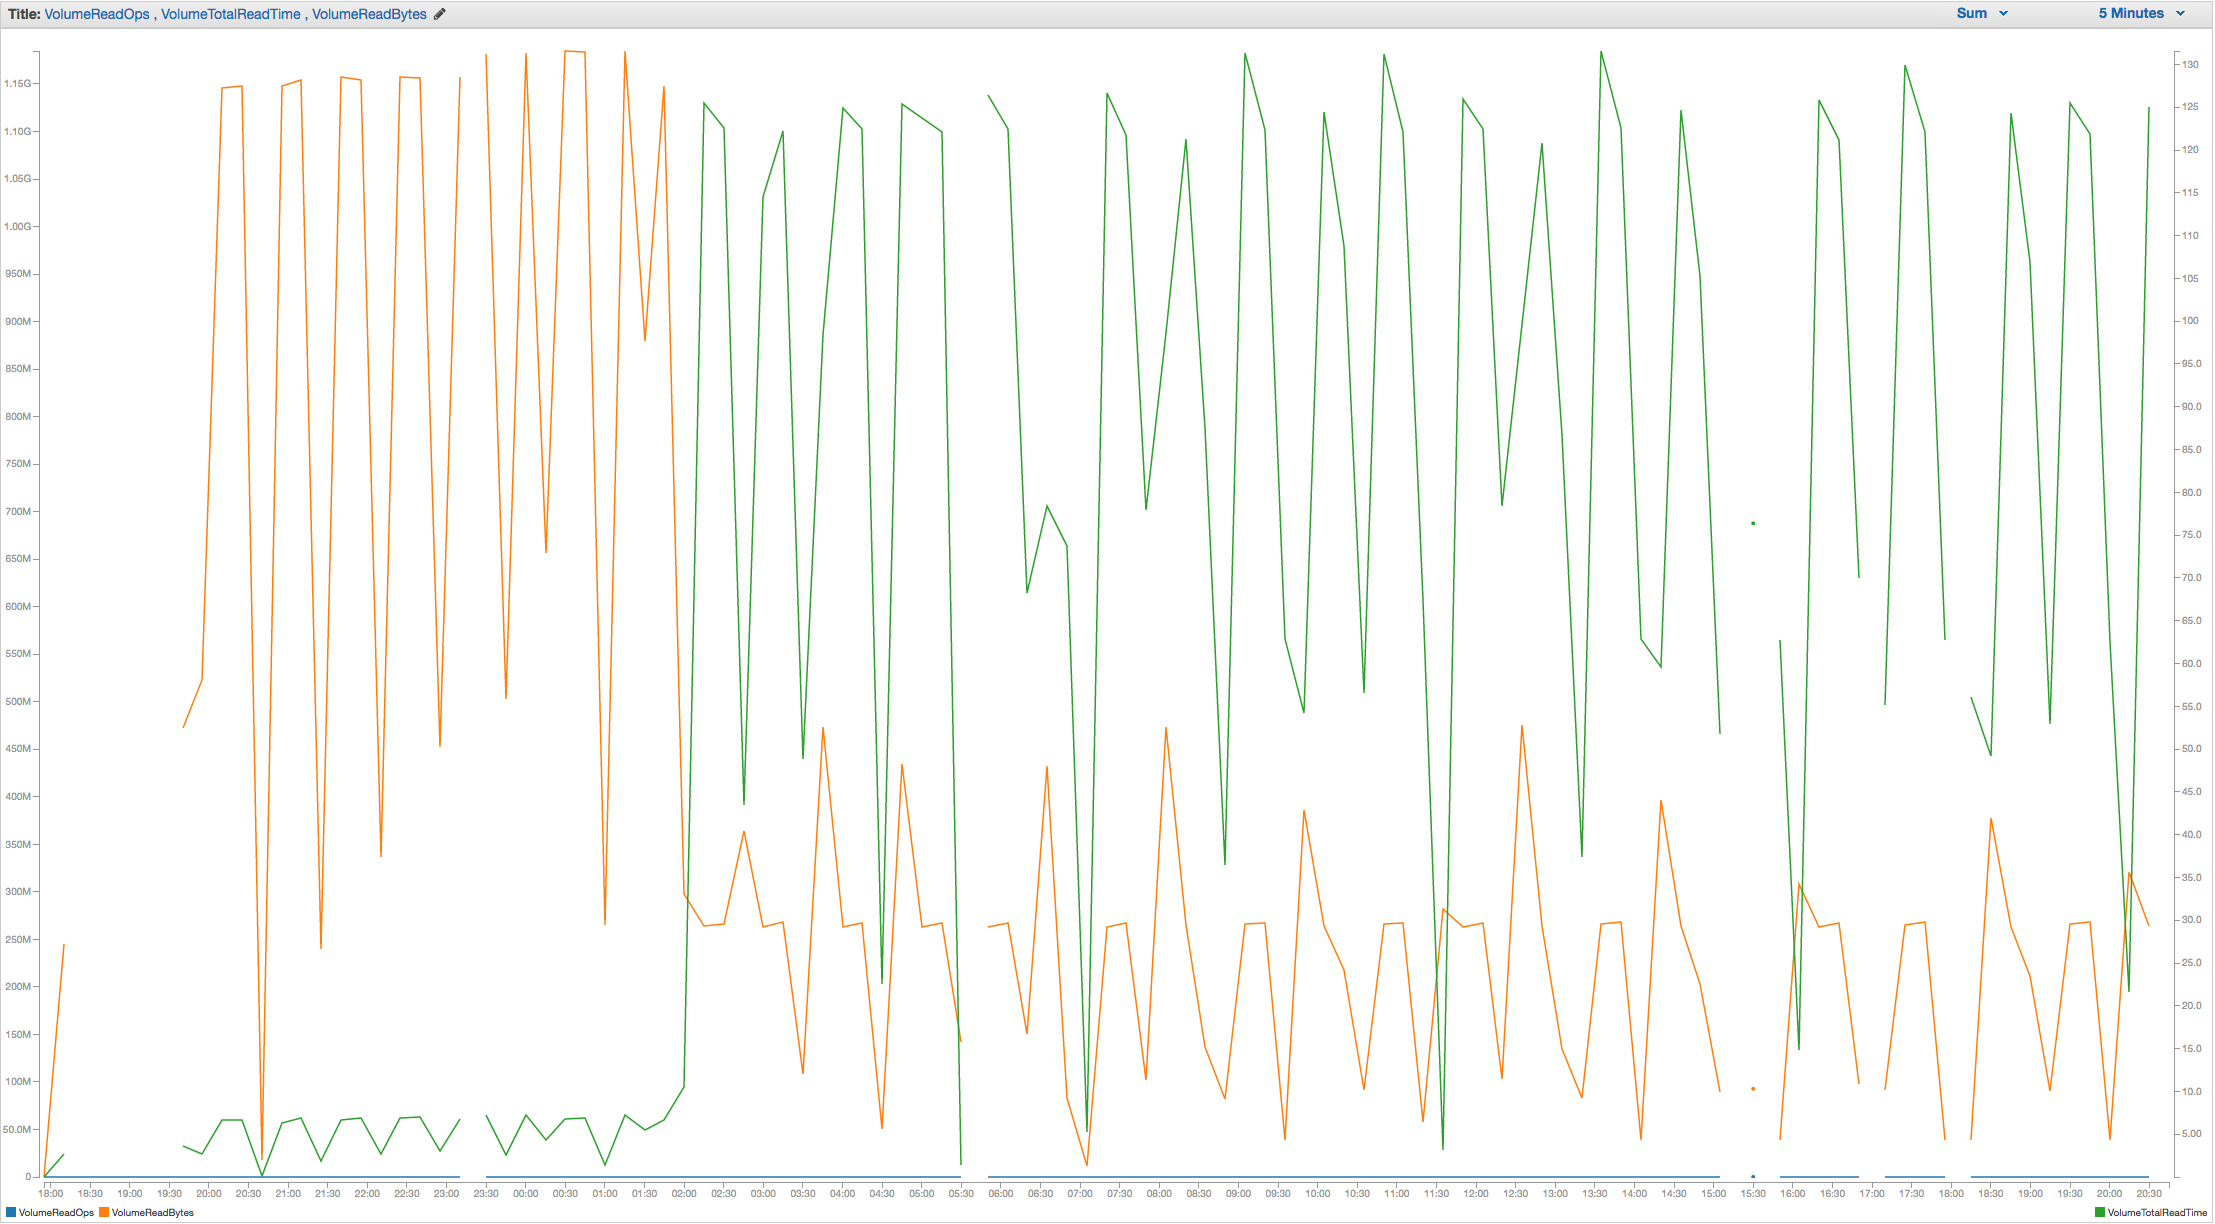
As a result, the entire namespace file for every database gets pulled into memory every time the TTLMonitor executes (every 60 seconds by default). Of course, the default namespace file size is only 16MBs, so this really isn’t an issue in the most common case. However, if you want to set up a development environment for a number of users on a single host, you will find yourself scratching your head as to why performance is so bad. It should be noted that performance will be bad regardless of user activity, database size, or the presence of TTL indexes (all of which would only serve to exacerbate the situation).
In addition to the development use case, it is possible to run into similar issues with a single database that has many collections/indexes and requires a namespace file larger than the default (up to 2048 MBs). In this case, both the TTLMonito and any command that involves a namespace file scan (e.g., listCollections) will cause issues.
To reproduce this behavior, you can spin up a t2.small instance on AWS, attach a 33 GB gp2 volume, deploy MongoDB 3.0.12, ensure that dbpath points to a a directory that lives on the attached volume, and, finally, restore the attached dump. You should see read behavior on that volume that resembles the attached graphs and vmstat dump with zero user activity.
At the very least, I think this should be explicitly documented in order to save time/confusion on the part of developers/operations and to help with capacity planning and architecture decisions going forward.
Greg
- is duplicated by
-
-
- Closed
-
- is related to
-
-
- Closed
-