-
Type:
Bug
-
Resolution: Duplicate
-
Priority:
 Major - P3
-
None
-
Affects Version/s: None
-
Component/s: None
-
None
-
ALL
-
None
-
None
-
None
-
None
-
None
-
None
-
None
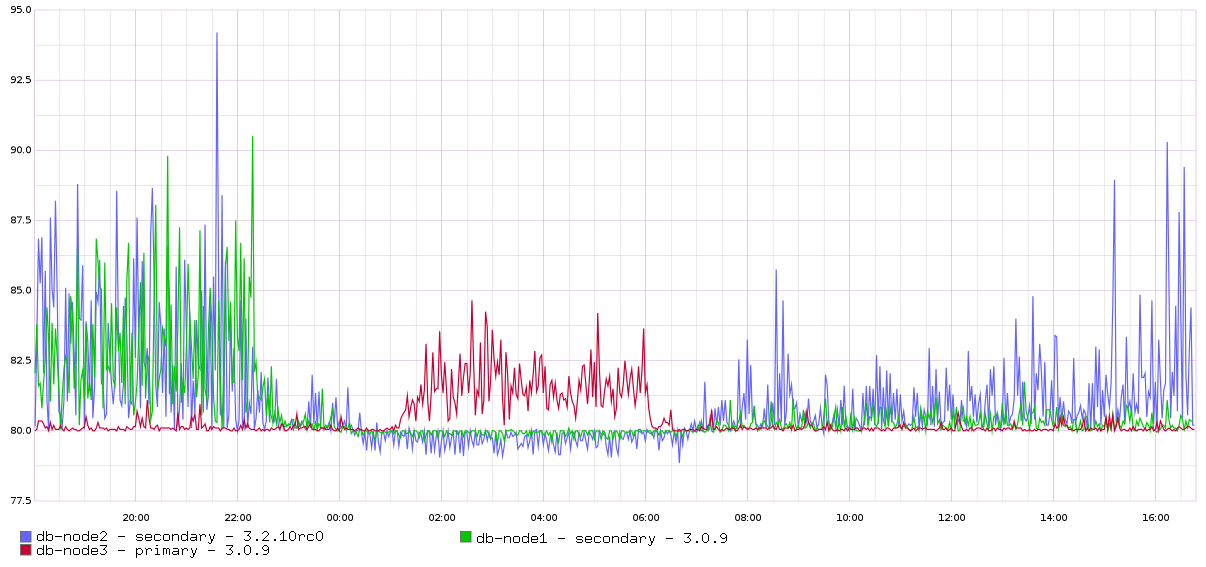
We upgraded a secondary of a 3 node cluster to 3.2.9.
By default when we upgrade we use iptables to allow replication but block clients.
Upon allowing clients cache went up to ~96% and failed to drop. Only 1 (of 16) cores appeared to be in use.
Blocking clients, restarting and allowing replication caused the oplog to catch up but still over time the cache fills and the performance hits rock bottom.
mongostat
insert query update delete getmore command % dirty % used flushes vsize   res qr|qw ar|aw netIn netOut conn   set repl                 time
    *6    *0    *14     *1       0    14|0     1.3   96.0       0 21.9G 21.1G   0|0  0|16 1.23k   127k   16 floow  SEC 2016-09-10T20:18:27Z
    *1    *0    *21     *2       0    13|0     1.3   96.0       0 21.9G 21.1G   0|0  0|16 1.07k   127k   16 floow  SEC 2016-09-10T20:18:28Z
    *0    *0     *0     *0       0     9|0     1.3   96.0       0 21.9G 21.1G   0|0  0|16  917b  93.2k   16 floow  SEC 2016-09-10T20:18:29Z
    *9    *0    *29     *1       0    12|0     1.3   96.0       0 21.9G 21.1G   0|0  0|16 1.01k   126k   16 floow  SEC 2016-09-10T20:18:30Z
    *2    *0     *4     *1       0    13|0     1.3   96.0       0 21.9G 21.1G   0|0  0|16 1.17k   126k   16 floow  SEC 2016-09-10T20:18:31Z
   *24    *0   *161    *10       0    14|0     1.3   96.0       0 21.9G 21.1G   0|0  0|15 1.13k   127k   16 floow  SEC 2016-09-10T20:18:32Z
iostat:
09/10/2016 08:18:51 PM
avg-cpu:  %user   %nice %system %iowait  %steal   %idle
           6.51    0.00    0.06    0.13    0.00   93.30

Device:         rrqm/s   wrqm/s     r/s     w/s    rkB/s    wkB/s avgrq-sz avgqu-sz   await r_await w_await  svctm  %util
xvda              0.00     0.00   22.00    0.00    92.00     0.00     8.36     0.04    2.00    2.00    0.00   0.18   0.40
xvdh              0.00    99.00   21.00   17.00   260.00  1292.00    81.68     0.06    1.47    0.57    2.59   0.63   2.40
xvdz              0.00     0.00    0.00    0.00     0.00     0.00     0.00     0.00    0.00    0.00    0.00   0.00   0.00
replication status (command took 10-15min to return):
db-node2(mongod-3.2.9)[SECONDARY:floow] test>rs.printReplicationInfo()
configured oplog size:   614400MB
log length start to end: 958414secs (266.23hrs)
oplog first event time:  Tue Aug 30 2016 14:06:44 GMT+0000 (UTC)
oplog last event time:   Sat Sep 10 2016 16:20:18 GMT+0000 (UTC)
now:                     Sat Sep 10 2016 20:25:01 GMT+0000 (UTC)
Upon restart (which often takes ages) replication catches up but then the cache fills and the scenario repeats.
Note: Other nodes are running 3.0 still.
I also experimented with changing WT parameters with no joy.
We will downgrade but leaving at 3.2.9 with low priority for now to allow for diagnostics and logs if required.
With 3.0 we still have cache filling issues but they occur once or twice a month, with our workload mmap was pretty much maintenance-free (very stable, minimal issues [except the disk usage], 3.0 WT causes some pain but it's manageable, 3.2 WT is unusable.

- duplicates
-
-

- Closed
-