-
Type:
Question
-
Resolution: Done
-
Priority:
Major - P3
-
None
-
Affects Version/s: 1.6.5
-
Component/s: Performance
-
None
-
Environment:Ubuntu 10.04
-
None
-
None
-
None
-
None
-
None
-
None
-
None
I'm trying to delve deeper into MongoDB memory/disk usage patterns to both optimize my configuration and to identify warning signs for impending performance problems. I have some high level questions first:
- mongod resident memory: I generally don't see this go above half the available RAM. Any idea what causes resident memory size to grow vs pages just sticking in the OS file cache?
- Is there any way to distinguish between memory warming up and an actual memory crunch? Any metrics/ratios to look out for in tools like iostat, sar, vmstat, etc.?
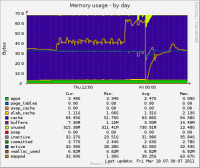
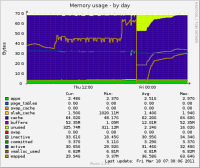
- Are there any metrics you look at to indicate that RAM is nearly full? I'm graphing most metrics in "/proc/meminfo" over time, however, when it appears I've hit my RAM threshold, things like active RAM in /proc/meminfo is reported at only half of RAM. Inactive is the other half.
- Shouldn't the amount reported as "Mapped" in /proc/meminfo be a comprehensive number that indicates how much MongoDB has mapped and therefore how much memory it's using?

