-
Type:
Bug
-
Resolution: Done
-
Priority:
 Major - P3
-
None
-
Affects Version/s: 3.2.11, 3.2.12
-
Component/s: WiredTiger
-
None
-
Environment:FreeBSD 11, sharded, replicated.
-
ALL
-
-
None
-
None
-
None
-
None
-
None
-
None
-
None
Hi all,
We are currently benchmarking our workload against the following test environment:
- MongoDB 3.2.12 (also tested on 3.2.11)
- Sharded cluster (2 shards, pre-chunked, 1 shard has 1 node and the other has 2 nodes in a replica set)
- Each node has 2x20 core CPUs and 32GB of memory
- WiredTiger storage engine
- We are using 2 mongos
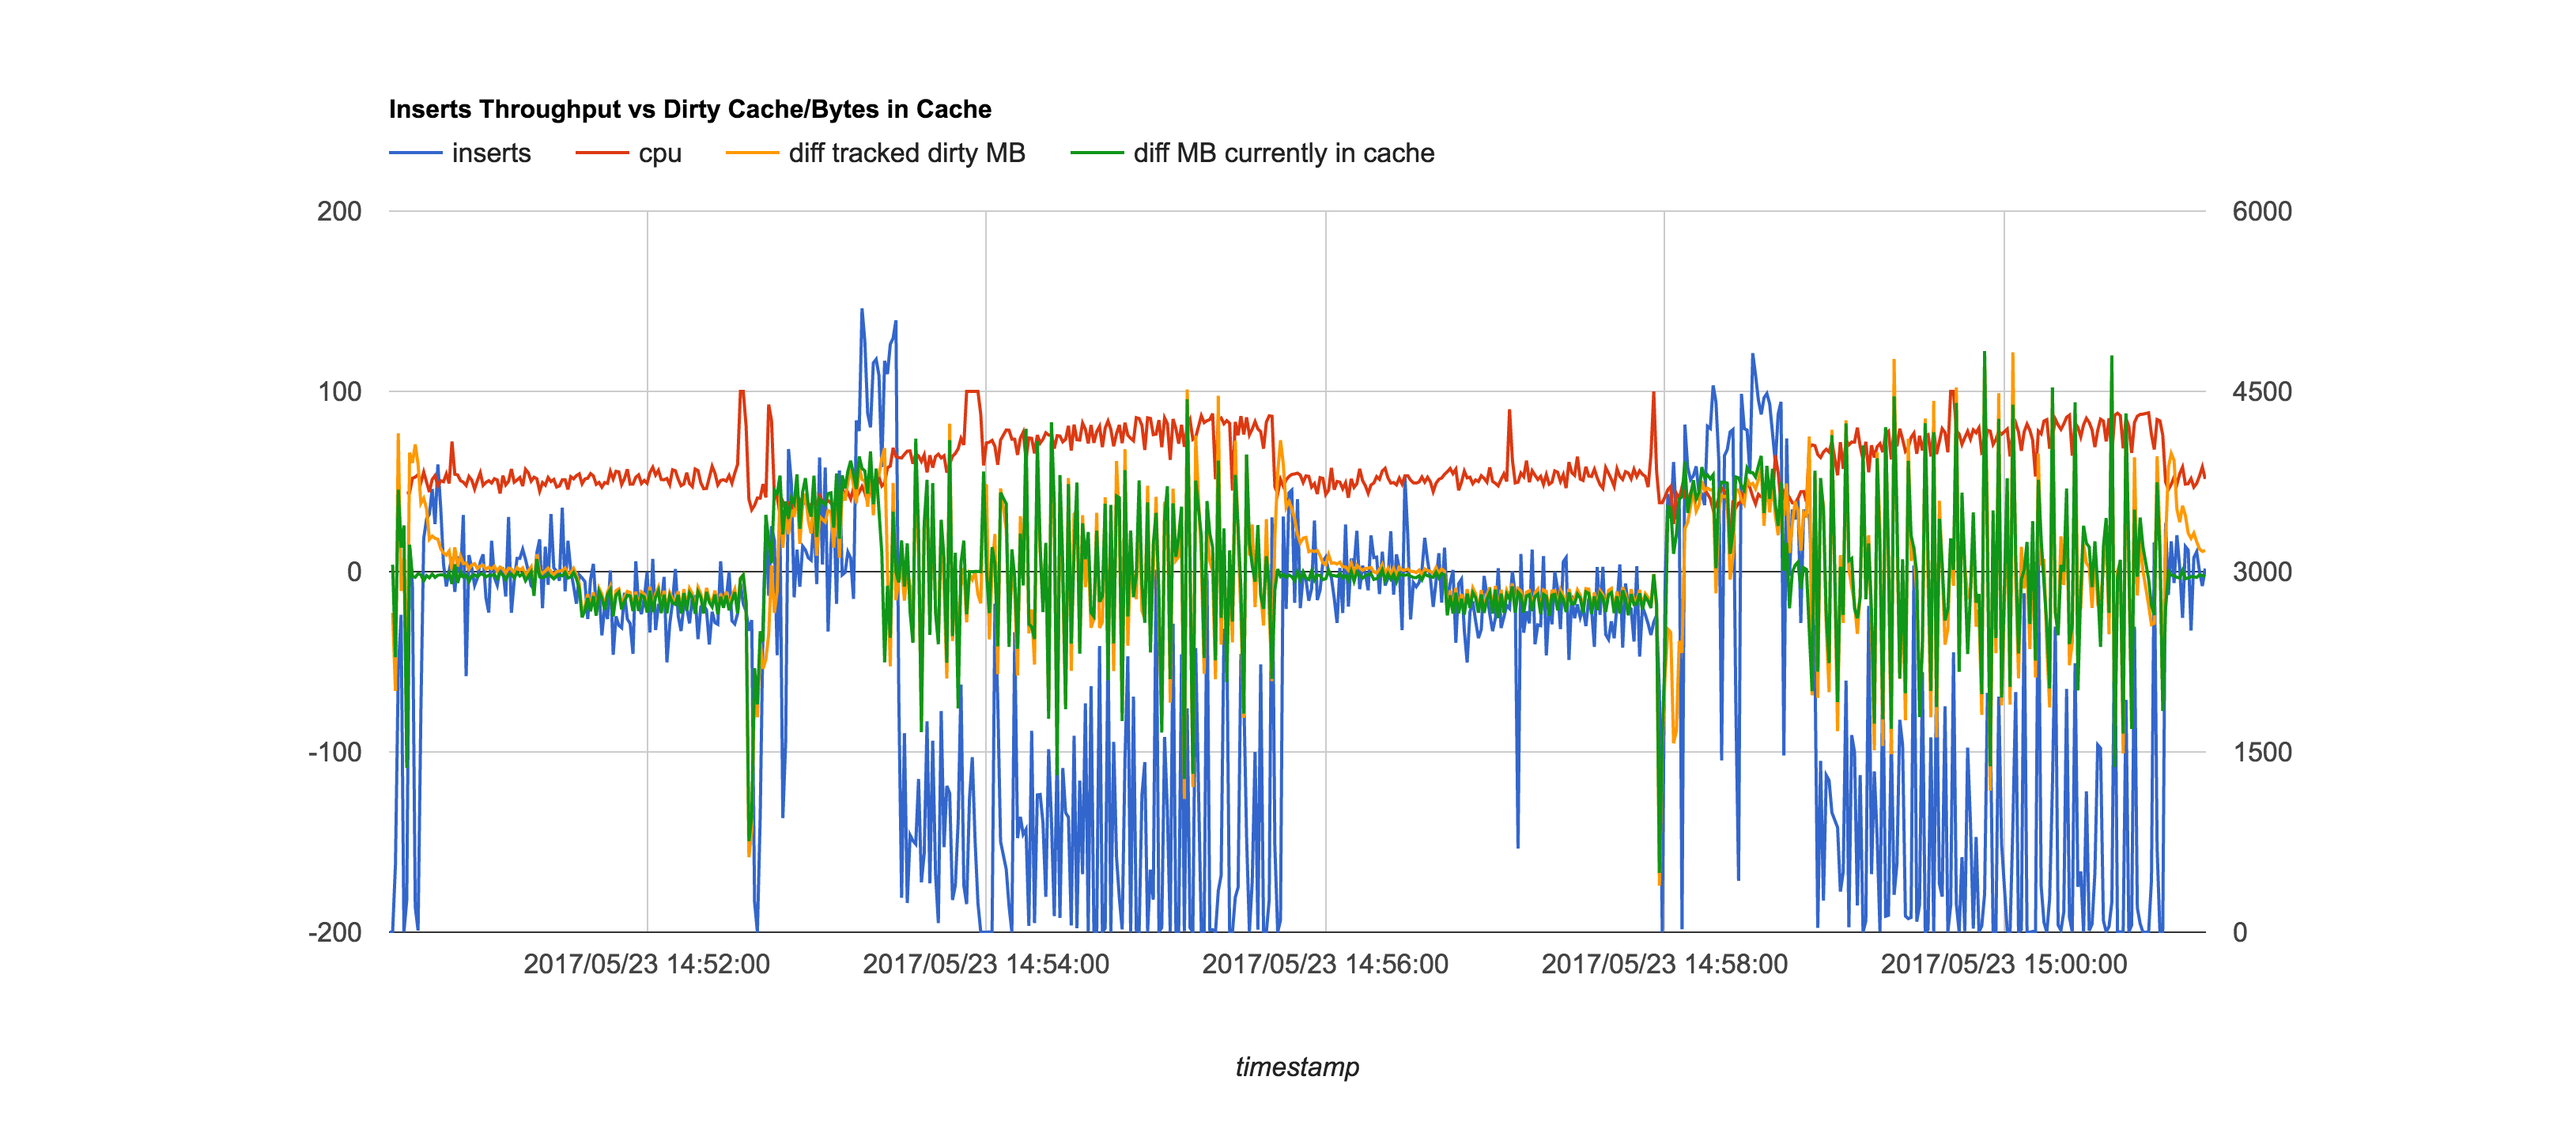
Our synthetic workload consists of 450 workers performing an insert, waiting for 1 to 100ms and then updating the same document (adding roughly 1k bytes) querying by the _id field. We routinely see throughput drops to 0 for both inserts and updates.
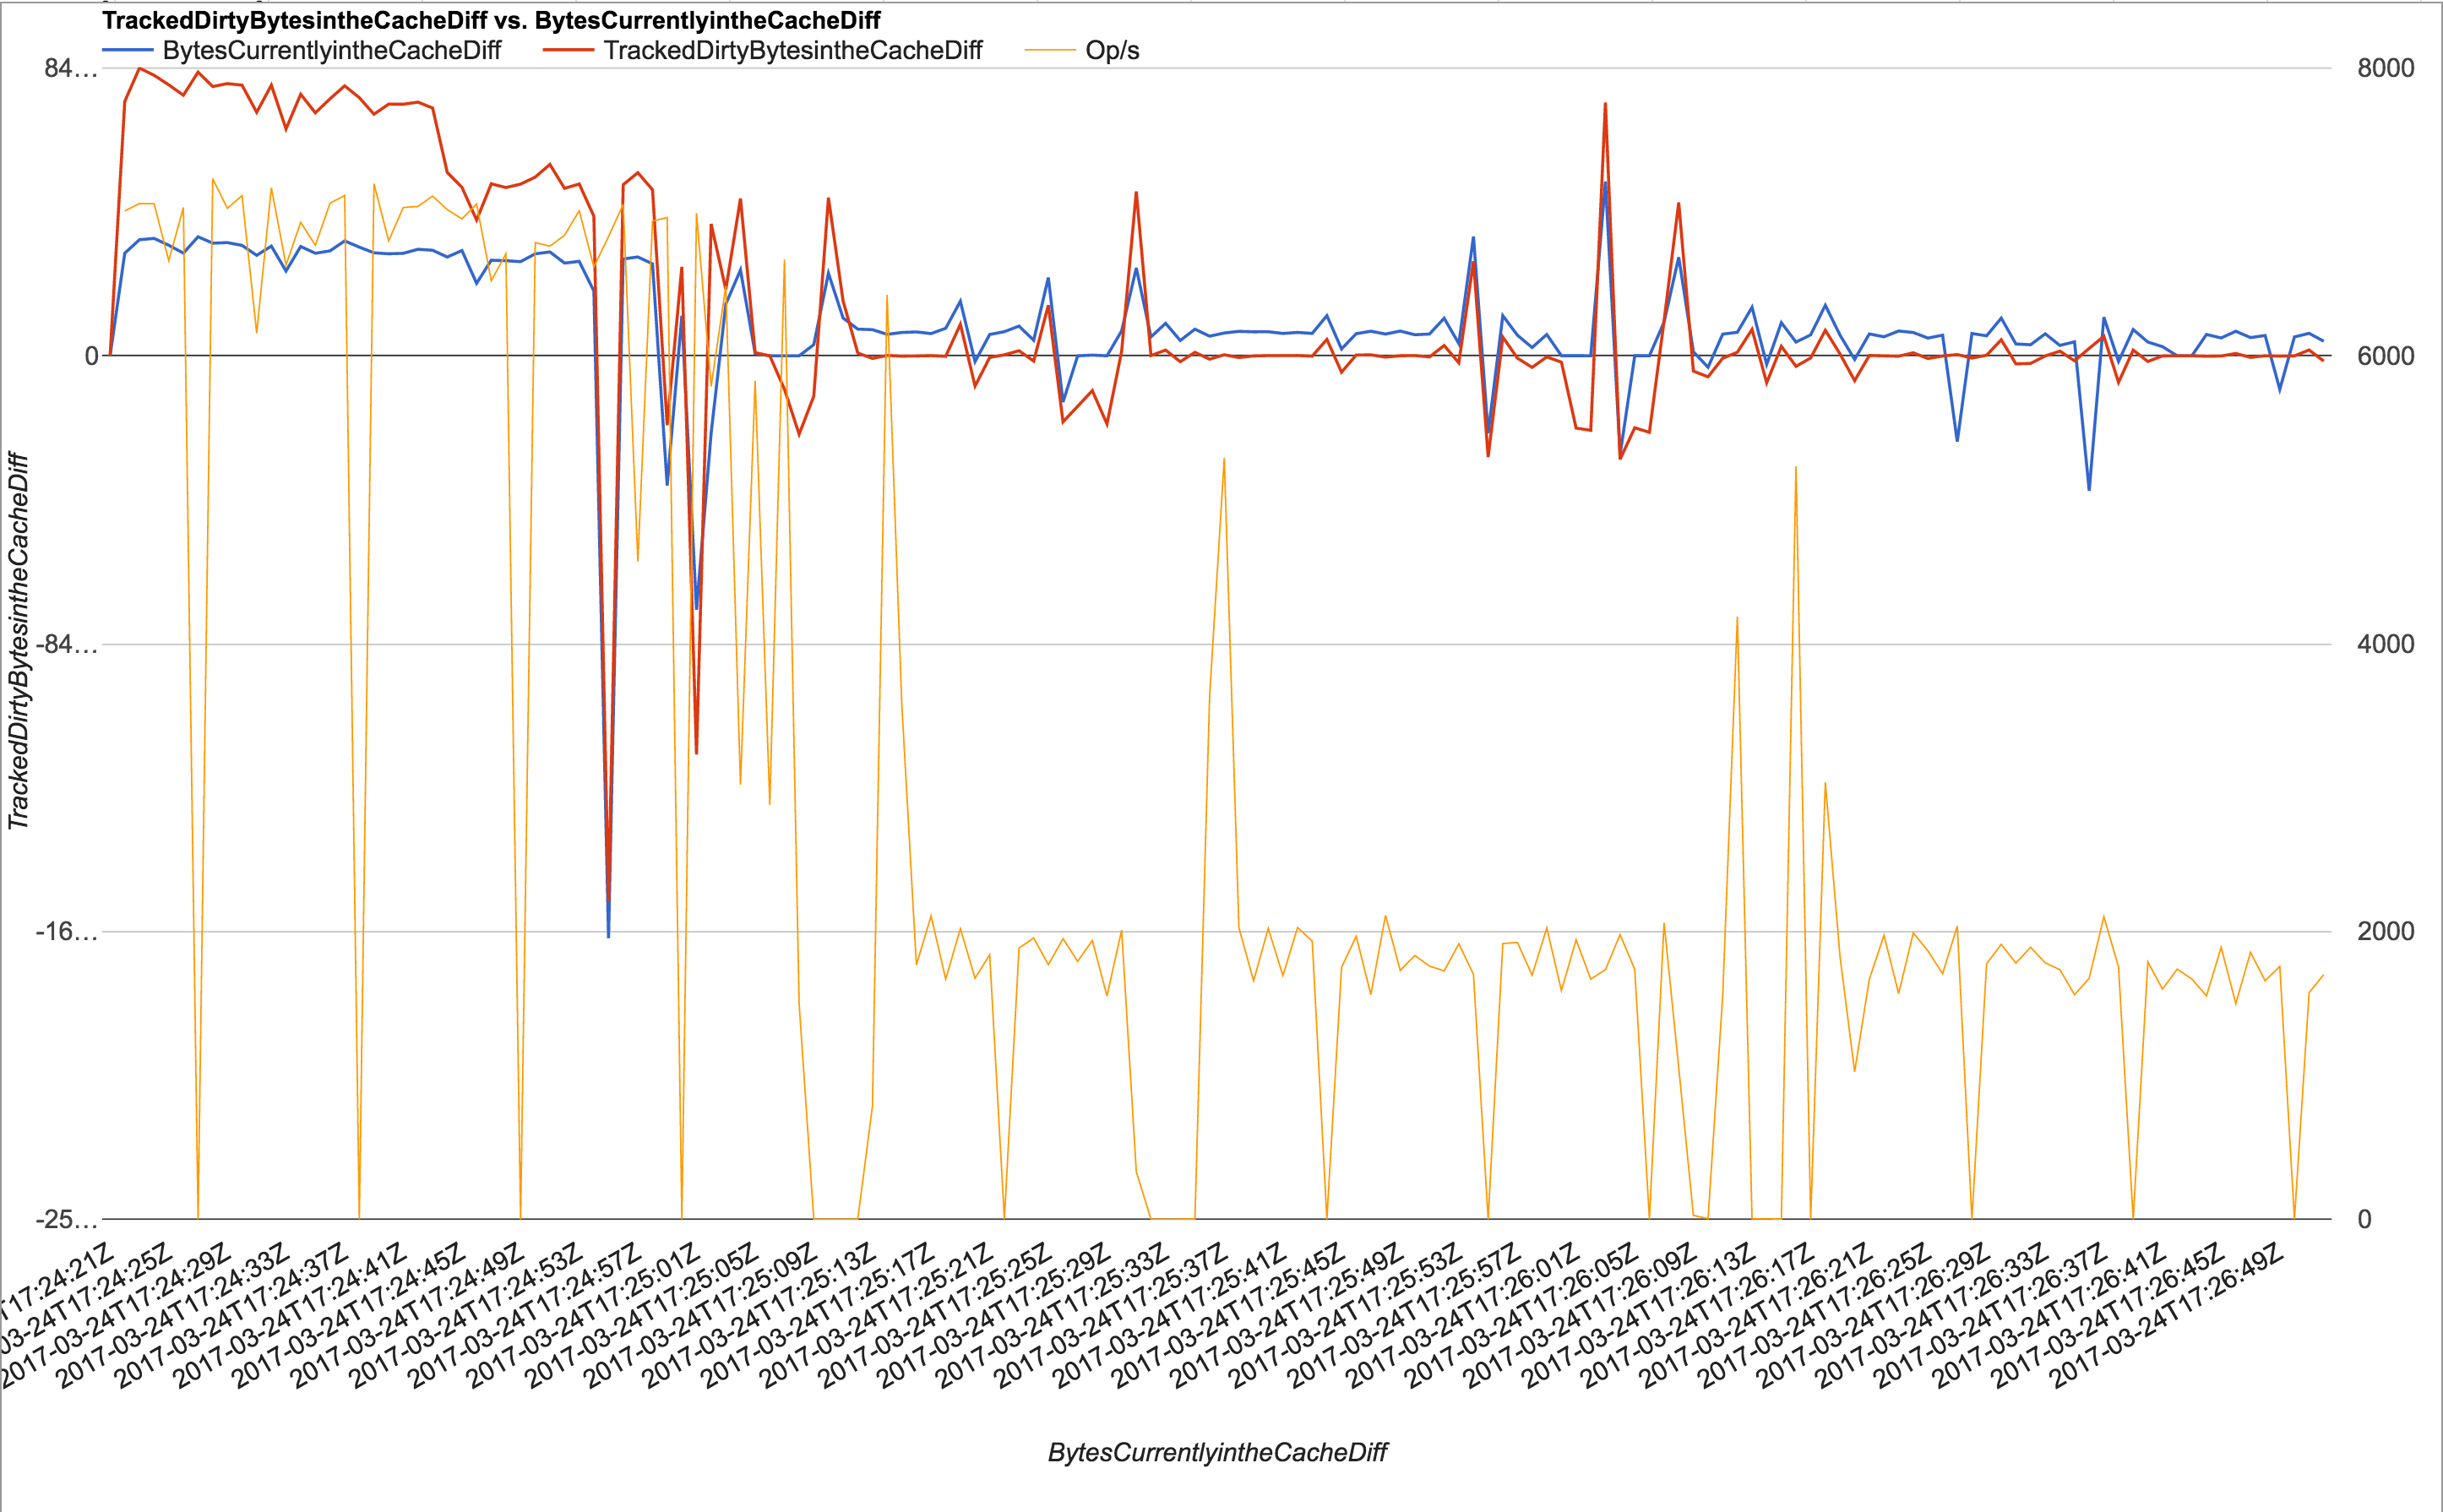
We've been collecting various stats while running the workload generator, and have correlated the drops to 0 throughput with a declining TrackedDirtyBytesInTheCache delta (measured every second using db.serverStatus()) which is what led us to believe it was related to the cache eviction.
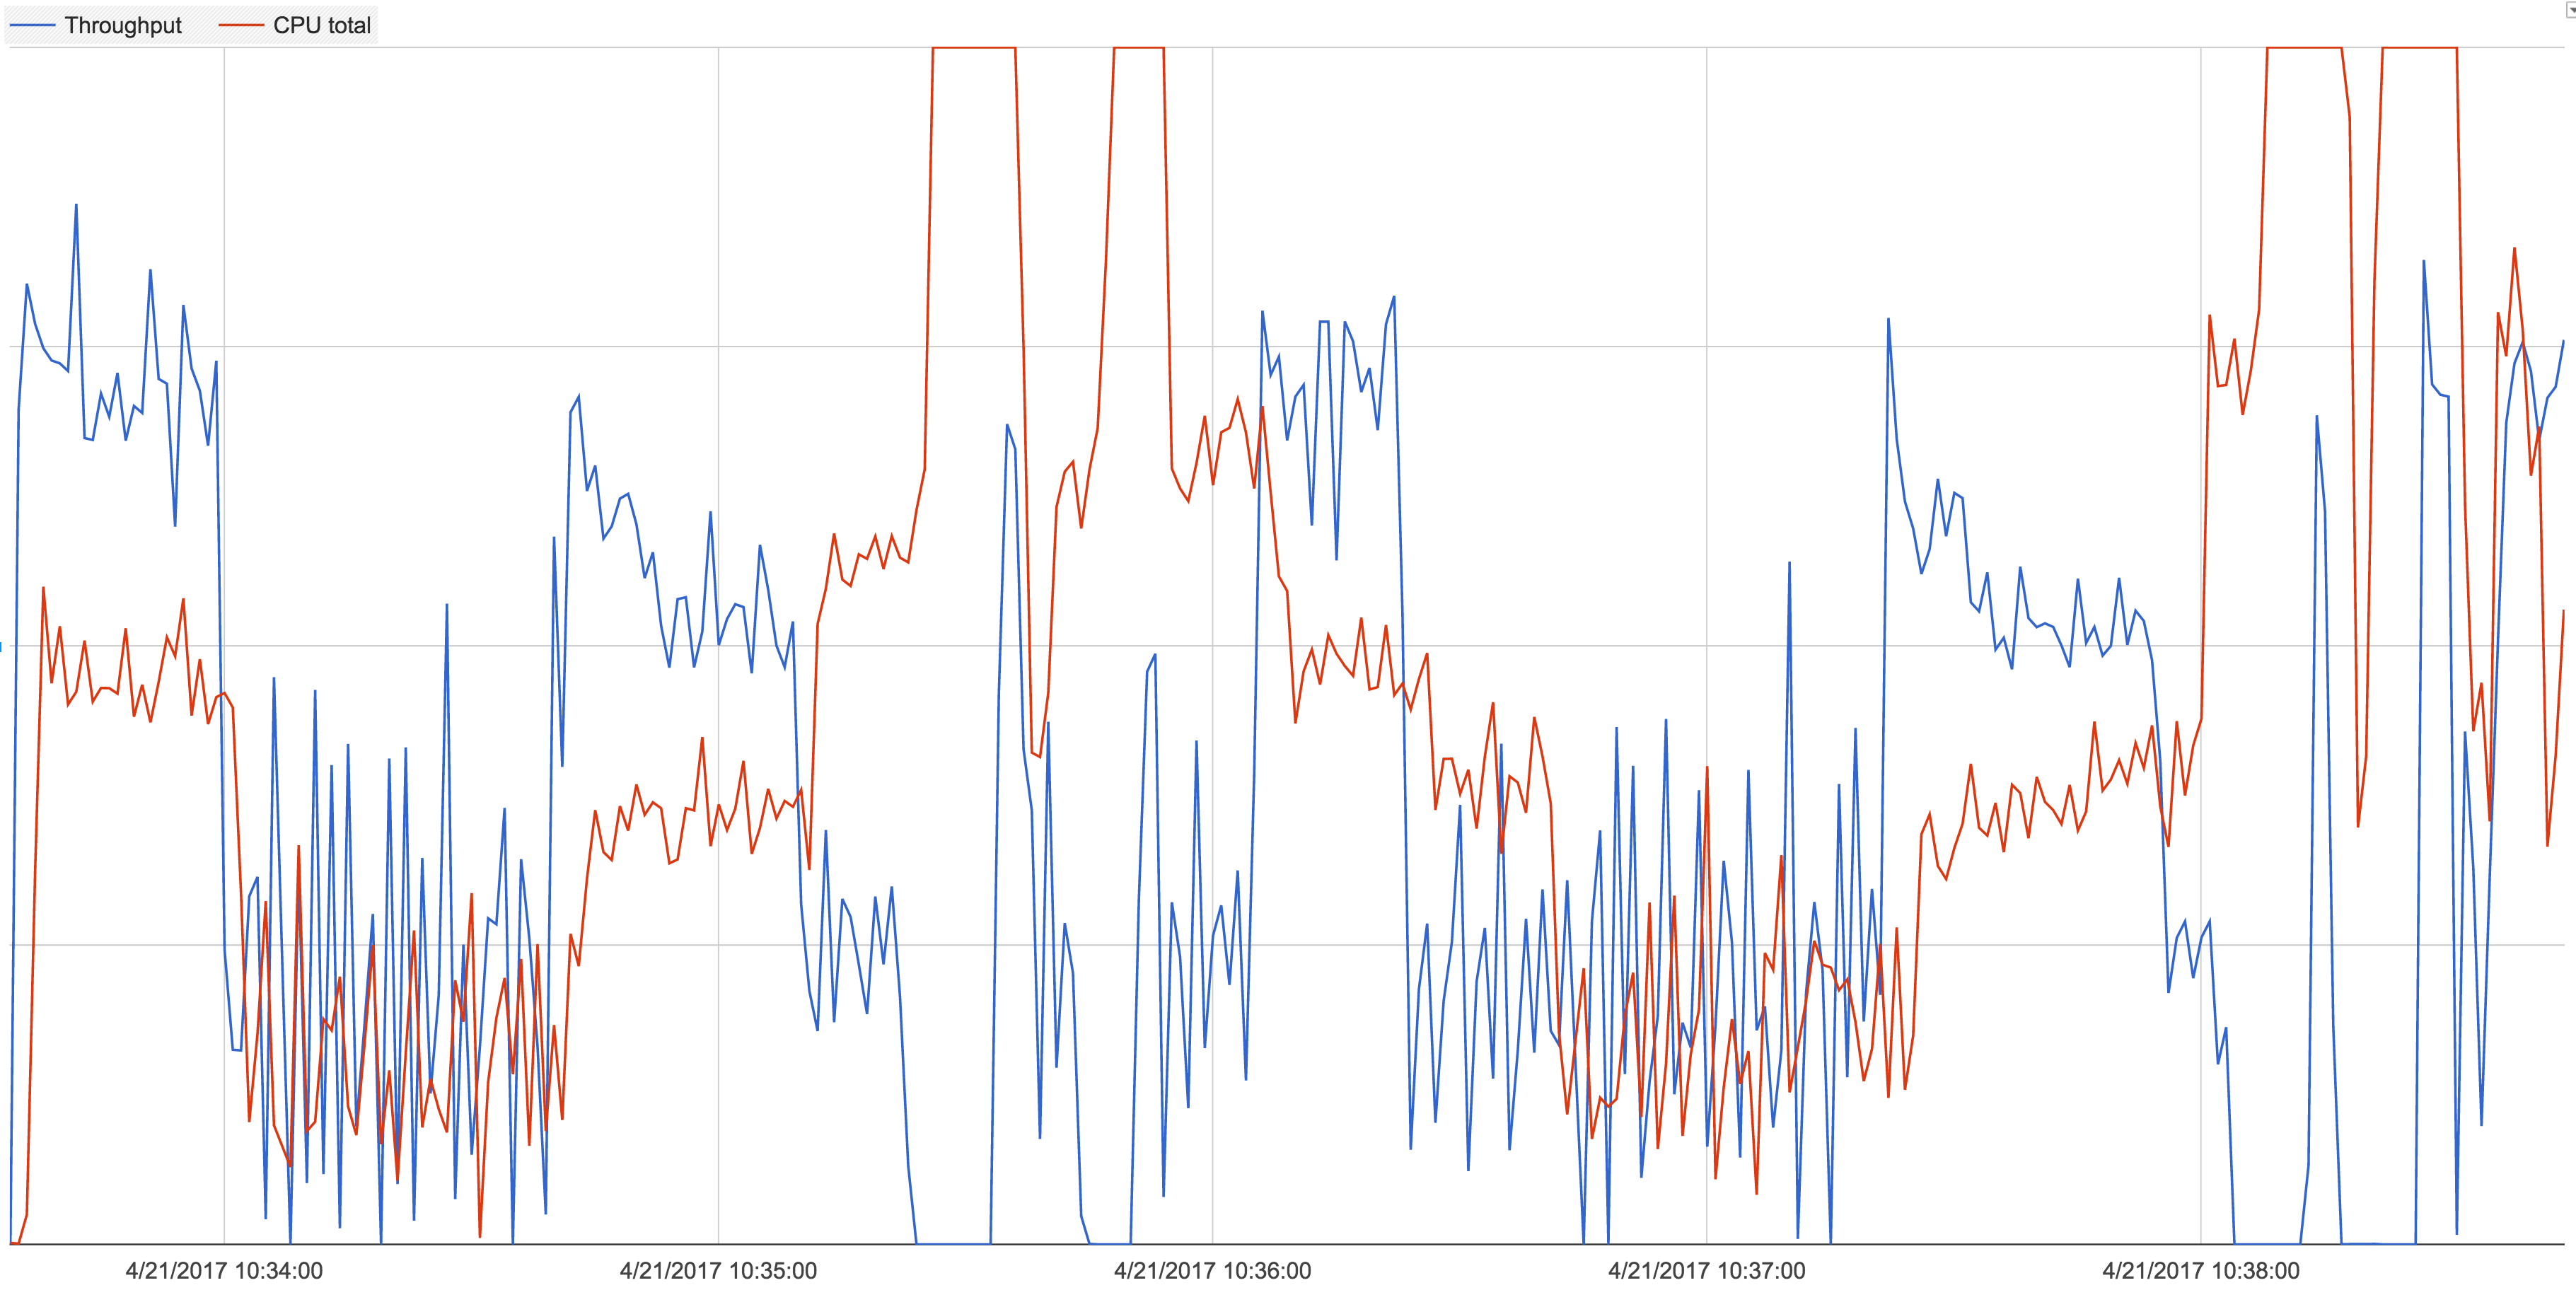
During periods of 0 throughput, the mongod boxes become CPU bound (40 core boxes) - this is what led us to conclude mongo was stalling as opposed to anything on application side. See the attached graph which is a plot of throughput vs. mongod CPU usage.
After resizing the wiredtiger cache from 19GB to 1GB (with wiredTiger.engineConfig.cacheSizeGB=1) the throughput drops are much shorter in duration but still noticeable. We also tested setting eviction_dirty_trigger=10 and eviction_dirty_target=7 (with a 19GB cache) as suggested in https://jira.mongodb.org/browse/SERVER-28488 but we still see periods of 0 throughput.
I have uploaded diagnostic data from a mongod instance previously under ticket #28488, and below are a couple of links to various stats we've recorded during various (different) testing runs in the hope they help. I can run tests and provide any info needed over the next couple of weeks. Sorry for the dupe ticket, but it has been over a month without a response.
To clarify, our workload generator is the only application running on a 40 CPU core box, connected via a 1Gbps LAN to mongos - it performs no IO other than talking to mongo, it's sole purpose is to load test mongo. Monitoring the network interface, we never come remotely close to maxing the link, and we're nowhere near maxing the CPU of the host at any point - we are not I/O bound as claimed in the other ticket.
CPU + disk IO stats: https://docs.google.com/a/itsallbroken.com/spreadsheets/d/1o6N23E_Nc1dBnFC_XXs6qWAXcdKAGjlgRuGHuVEXzn0/edit?usp=sharing
db.serverStatus() + TrackedDirtyBytesInTheCache plot (switch sheets): https://docs.google.com/a/itsallbroken.com/spreadsheets/d/1tsK8vOun4IHyfhpA7mXQ9GrO9zneoWvL2dENj2EImug/edit?usp=sharing


- is duplicated by
-
-
- Closed
-