-
Type:
Bug
-
Resolution: Duplicate
-
Priority:
 Major - P3
-
None
-
Affects Version/s: 3.2.12
-
Component/s: None
-
None
-
Fully Compatible
-
ALL
-
None
-
None
-
None
-
None
-
None
-
None
-
None
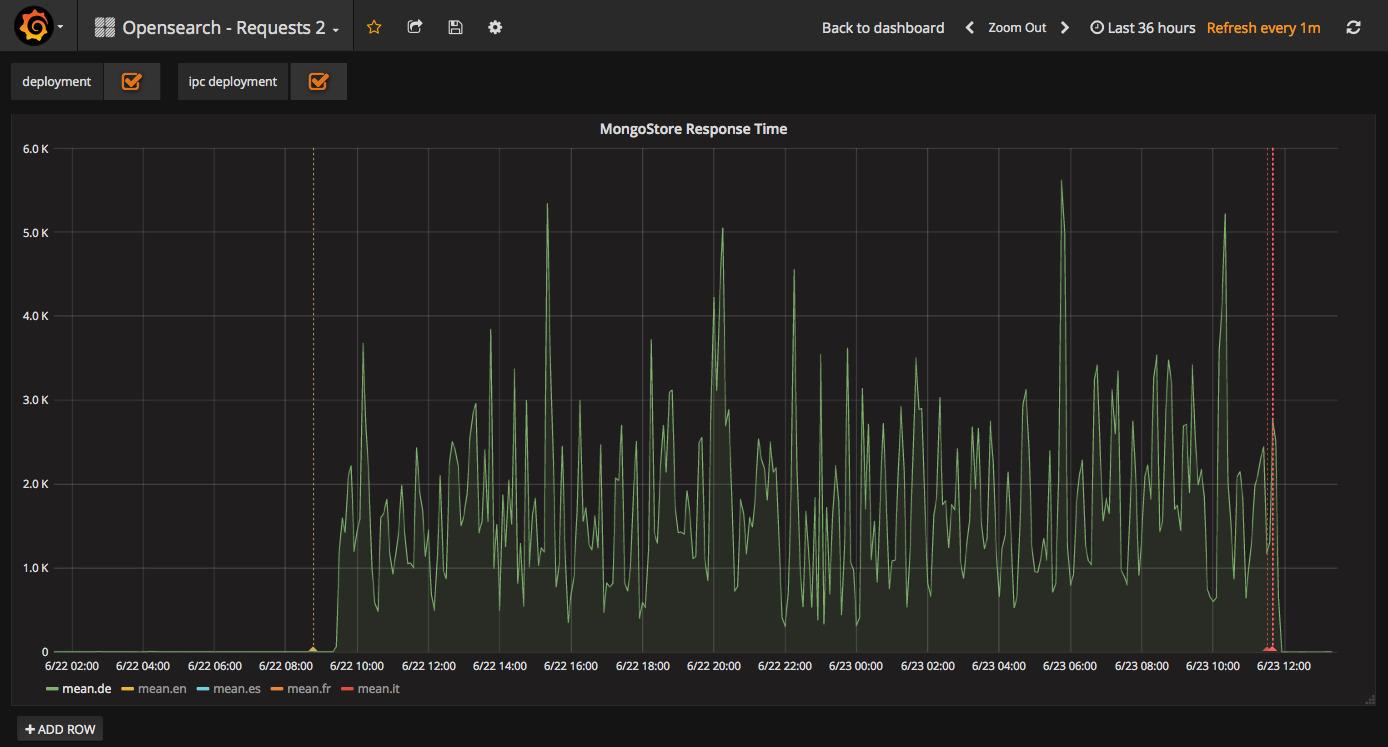
After having dropped some unused indexes through mongos, reads (using an index) from secondaries were more than 100 times slower than before (over 3000 ms). Reads from primaries were still fast as usual (1-5 ms). Since the issue persisted for over 24 hours, we restarted all secondaries, which resolved the issue immediately.
Please see attached a screenshot from our monitored response times. We dropped the unsused indexes at 09:30 and restarted the secondaries the next day at 12:00 o'clock. You can see that the response times went up dramatically during this period.
I attach also the log file from one of our secondaries, called mongo-077, where you see that queries on field "offerId" became very slow after dropping the unused indexes. Our slowMs value is set to 3000 ms (instead of the default 100 ms). This is why you won't find queries on field "offerId" in the log before we dropped the unused indexes because they were always faster than 3000 ms.
Mongodb version:
2017-06-22T06:38:11.431+0200 I CONTROL  [signalProcessingThread] pid=38407 port=27017 64-bit host=mongo-007
2017-06-22T06:38:11.431+0200 I CONTROL  [signalProcessingThread] db version v3.2.12
2017-06-22T06:38:11.431+0200 I CONTROL  [signalProcessingThread] git version: ef3e1bc78e997f0d9f22f45aeb1d8e3b6ac14a14
2017-06-22T06:38:11.431+0200 I CONTROL  [signalProcessingThread] OpenSSL version: OpenSSL 1.0.1t  3 May 2016
2017-06-22T06:38:11.431+0200 I CONTROL  [signalProcessingThread] allocator: tcmalloc
2017-06-22T06:38:11.431+0200 I CONTROL  [signalProcessingThread] modules: none
2017-06-22T06:38:11.431+0200 I CONTROL  [signalProcessingThread] build environment:
2017-06-22T06:38:11.432+0200 I CONTROL  [signalProcessingThread]     distmod: debian71
2017-06-22T06:38:11.432+0200 I CONTROL  [signalProcessingThread]     distarch: x86_64
2017-06-22T06:38:11.432+0200 I CONTROL  [signalProcessingThread]     target_arch: x86_64