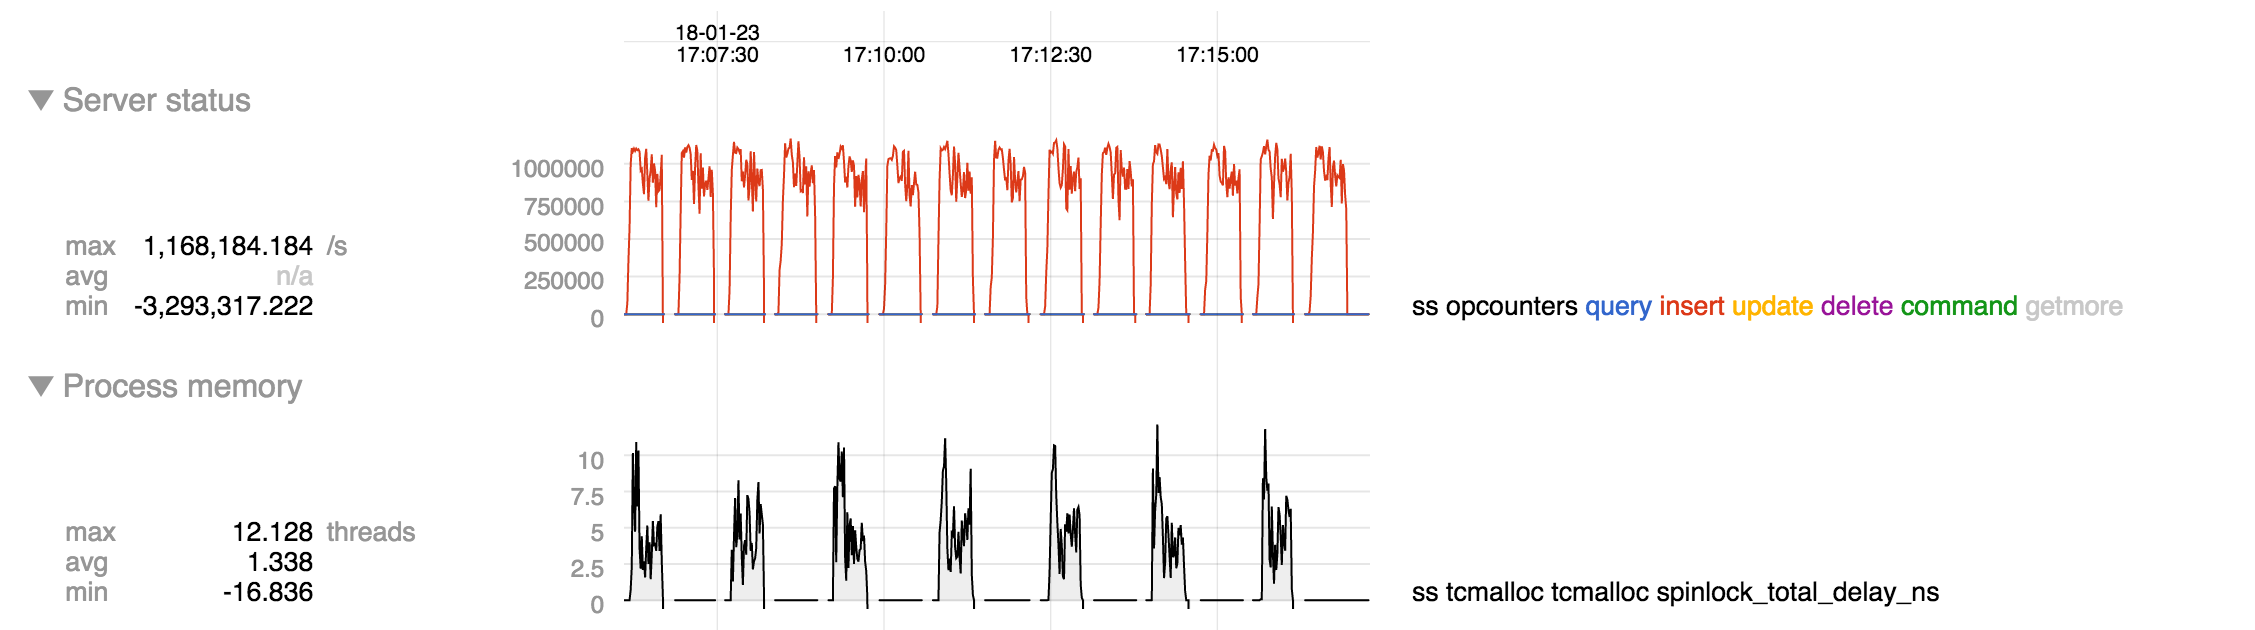
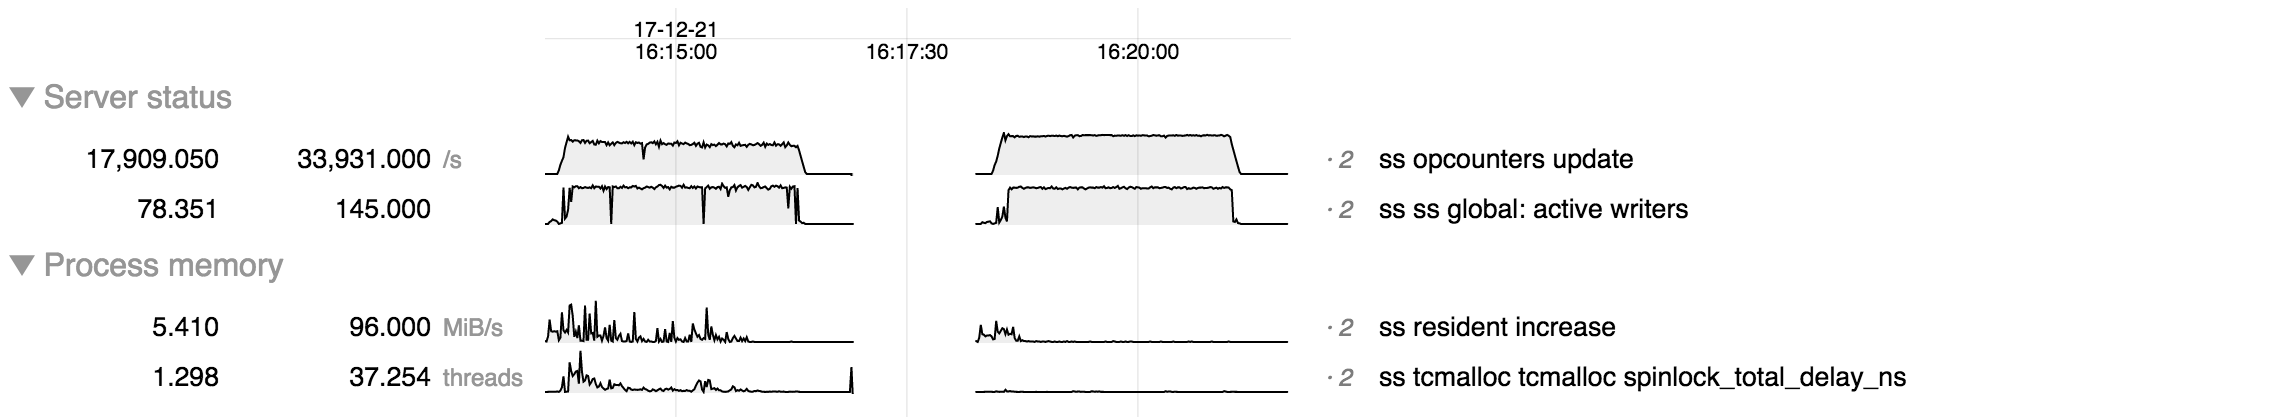
We sometimes encounter allocator bottlenecks that currently require asking users to collect stack traces with gdb to diagnose. We could diagnose these bottlenecks from FTDC data if we counted cumulative time spent waiting for the primary lock involved. Typical stacks for such a bottleneck look like this:
#0  0x00000000014a6f85 in base::internal::SpinLockDelay(int volatile*, int, int) ()
#1  0x00000000014a6e57 in SpinLock::SlowLock() ()
#2  0x00000000014a9393 in tcmalloc::CentralFreeList::RemoveRange(void**, void**, int) ()
#3  0x00000000014b4d2a in tcmalloc::ThreadCache::FetchFromCentralCache(unsigned long, unsigned long) ()
#0  0x00000000014a6f85 in base::internal::SpinLockDelay(int volatile*, int, int) ()
#1  0x00000000014a6e57 in SpinLock::SlowLock() ()
#2  0x00000000014a8efd in tcmalloc::CentralFreeList::InsertRange(void*, void*, int) ()
#3  0x00000000014b4ed8 in tcmalloc::ThreadCache::ReleaseToCentralCache(tcmalloc::ThreadCache::FreeList*, unsigned long, int) ()
#4  0x00000000014b4f7d in tcmalloc::ThreadCache::ListTooLong(tcmalloc::ThreadCache::FreeList*, unsigned long) ()