-
Type:
Improvement
-
Resolution: Won't Do
-
Priority:
 Major - P3
-
None
-
Affects Version/s: None
-
Component/s: Diagnostics
-
Service Arch
-
None
-
None
-
None
-
None
-
None
-
None
-
None
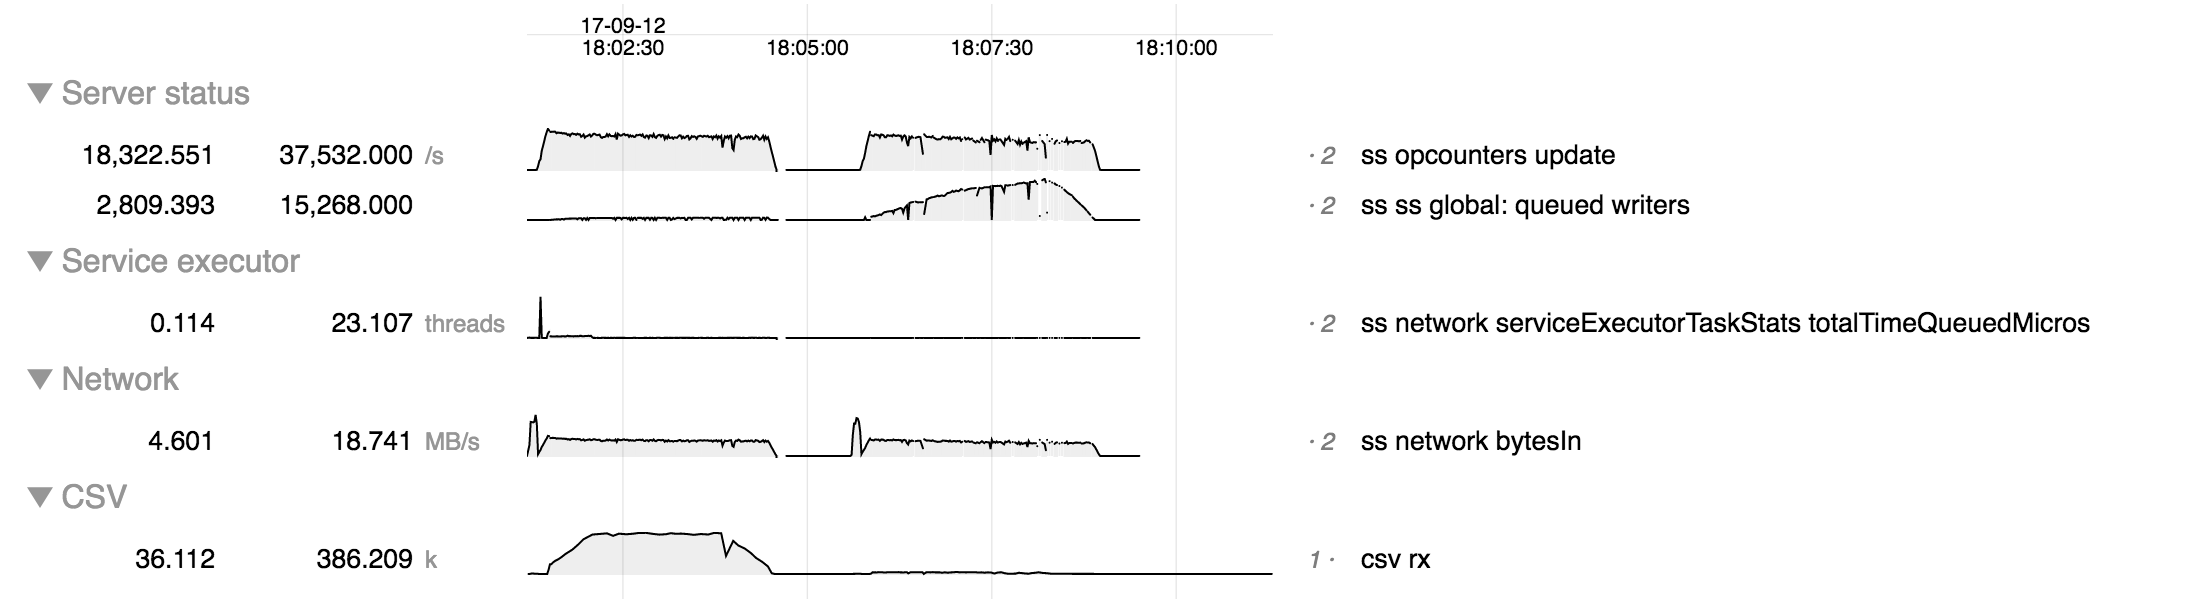
The adaptive service executor introduces a significant new queueing point. Two runs of test that ramps up to 20 k connections executing updates - first run is adaptive service executor, second run is synchronous (default) executor.

In the sync case (right) the signficant queuing point is the "queued writers" metric, but not in the adaptive case.
In the adaptive case (left) queuing occurs upstream of that. By monitoring /proc/net/tcp ("csv rx" chart) we can see far more requests queued in the network layer in the adaptive case than in the sync case. This represents about 1800 queued requests, so is a very significant queuing point, unlike in the sync case. Note that this only includes network data buffered in the kernel; there may possibly be signficant additional network data buffered in ASIO.
Understanding the queueing points is important for diagnosing bottleneck, so we should monitor buffered network data to support the adaptive service executor. This could be done
- at the kernel level (as above). However this would be global for the node (not specific to mongod) and would not include data buffered in ASIO.
- at the socket layer in mongod. This would be specific to mongod, but would not include whatever might be buffered in ASIO.
- via ASIO APIs, if available.
- is related to
-
SERVER-30623 Operation latency and queuing stats are incorrect for adaptive executor
-
- Closed
-