-
Type:
Question
-
Resolution: Done
-
Priority:
 Major - P3
-
None
-
Affects Version/s: None
-
Component/s: None
-
None
-
None
-
None
-
None
-
None
-
None
-
None
hi
my applicaton use secondary as a read concern of mongodb.
when i import lots of documents , developer notify me that their queries time out.
so ,i get some slowlog form errlog as follows :
-----------------------------------------------------------------------------------------------------
2017-09-26T09:02:09.722+0800 I COMMAND  [conn1680898] command
db.table command: find { find: "table", filter: { sid: { $in: [ "x", "y", "z"] } }, projection: { _id: 0, bssid: 1, loc: 1, accuracy: 1 } }
planSummary: IXSCAN { sid: 1 } keysExamined:6,docsExamined:3 cursorExhausted:1 numYields:0 nreturned:3 reslen:959
locks:{ Global: { acquireCount: { r: 2 }, acquireWaitCount: { r: 1 }, *+timeAcquiringMicros: { r: 12923929+* } }, Database: { acquireCount: { r: 1 } }, Collection: { acquireCount: { r: 1 } } } protocol:op_query 12933ms
--------------------------------------------------------------------------------------------------------
we can see locks section, timeAcquiringMicros is 12923929. wait time is so long.
As we known lock of WiredTiger is document level , why a query wait so long .
seeing from db.currentOp(), as following:
---------------------------------------------------------------------------------------------------------
                        "desc" : "rsSync",
                        "threadId" : "140284498736896",
                        "active" : true,
                        "opid" : 7,
                        "secs_running" : 3118,
                        "microsecs_running" : NumberLong("3118657970"),
                        "op" : "none",
                        "ns" : "local.replset.minvalid",
                        "query" : {

                        },
                        "numYields" : 0,
                        "locks" : {
                                "Global" : "W"
                        },
                        "waitingForLock" : true,
                        "lockStats" : {
                                "Global" : {
                                        "acquireCount" : {
                                                "r" : NumberLong(258933),
                                                "w" : NumberLong(518376),
                                                "R" : NumberLong(1),
                                                "W" : NumberLong(129595)
                                        },
                                        "acquireWaitCount" : {
                                                "W" : NumberLong(68687)
                                        },
                                        "timeAcquiringMicros" : {
                                                "W" : NumberLong(51701628)
                                        }
                                },
-----------------------------------------------------------------------------------------------
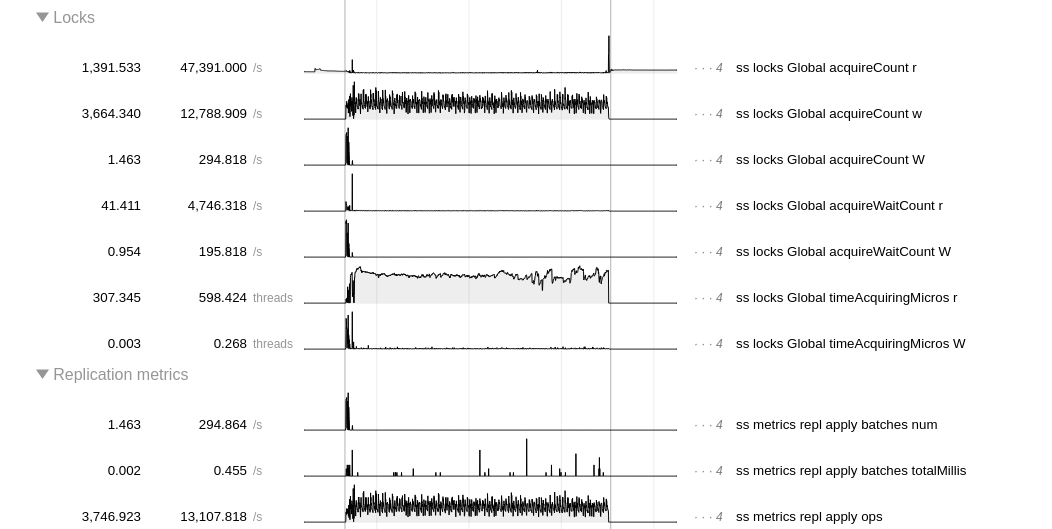
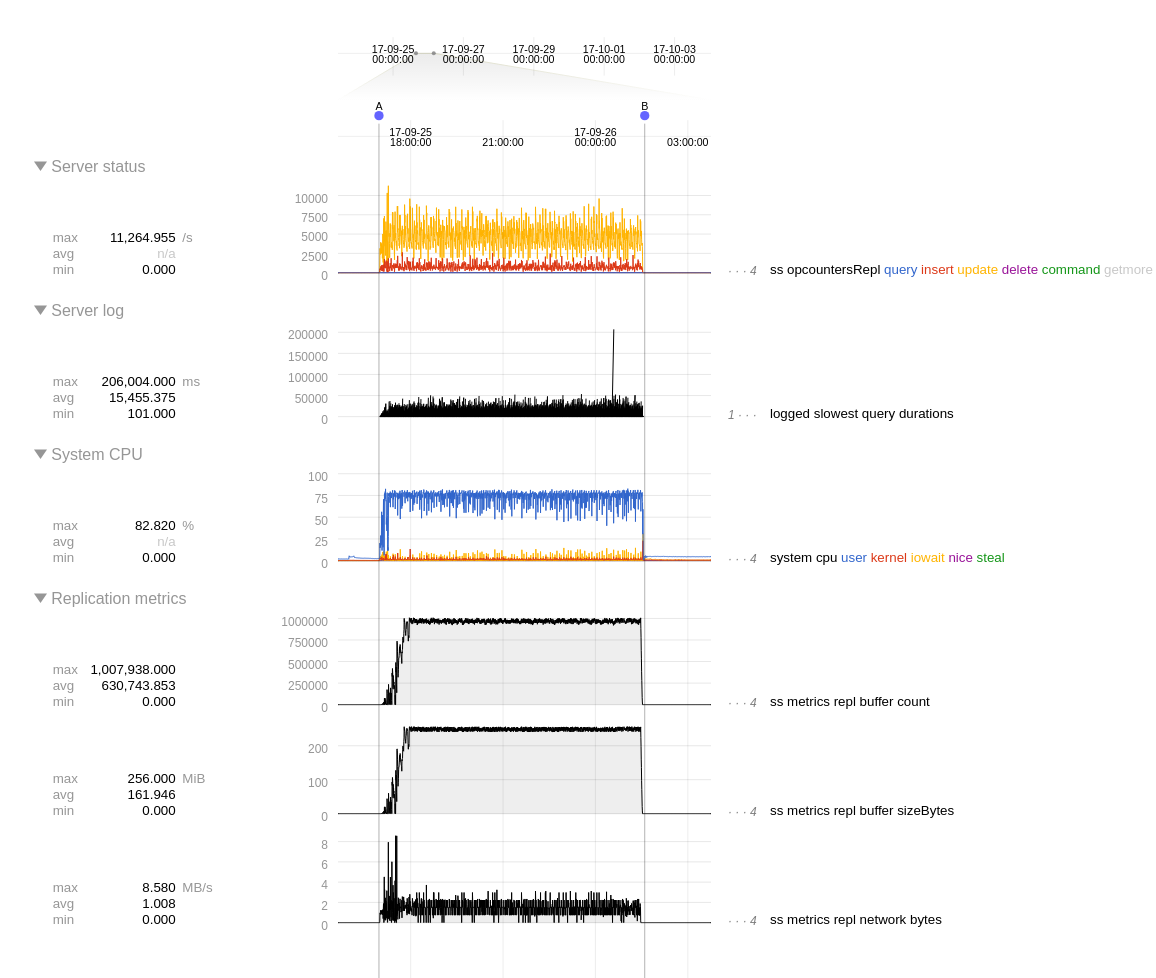
the rssync thead holds a global lock, and lockstats.Global.acquireCount.W is bigger and bigger。
so , the root case is the rssync thead holds global lock .
I use ycsb to benchmark a new replset reproduce this case. And monitor of global lock is high.
- is related to
-
SERVER-31399 repl.apply.batches.totalMillis does not record the time spent applying batches
-
- Closed
-
- related to
-
-
- Closed
-
-
SERVER-20328 Allow secondary reads while applying oplog entries
-
- Closed
-