-
Type:
Bug
-
Resolution: Fixed
-
Priority:
 Major - P3
-
Affects Version/s: 3.4.3
-
Component/s: WiredTiger
-
None
-
Fully Compatible
-
ALL
-
Storage NYC 2018-12-17
-
(copied to CRM)
-
None
-
None
-
None
-
None
-
None
-
None
-
None
Ok this one is an issue we're having regularly for months but couldn't pinpoint the cause, so now that we have managed to collect more data I'm opening a ticket.
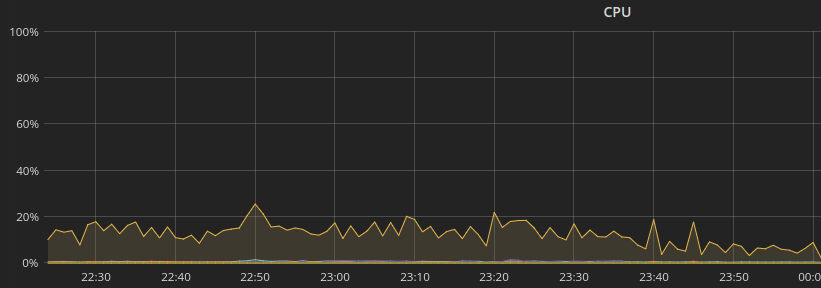
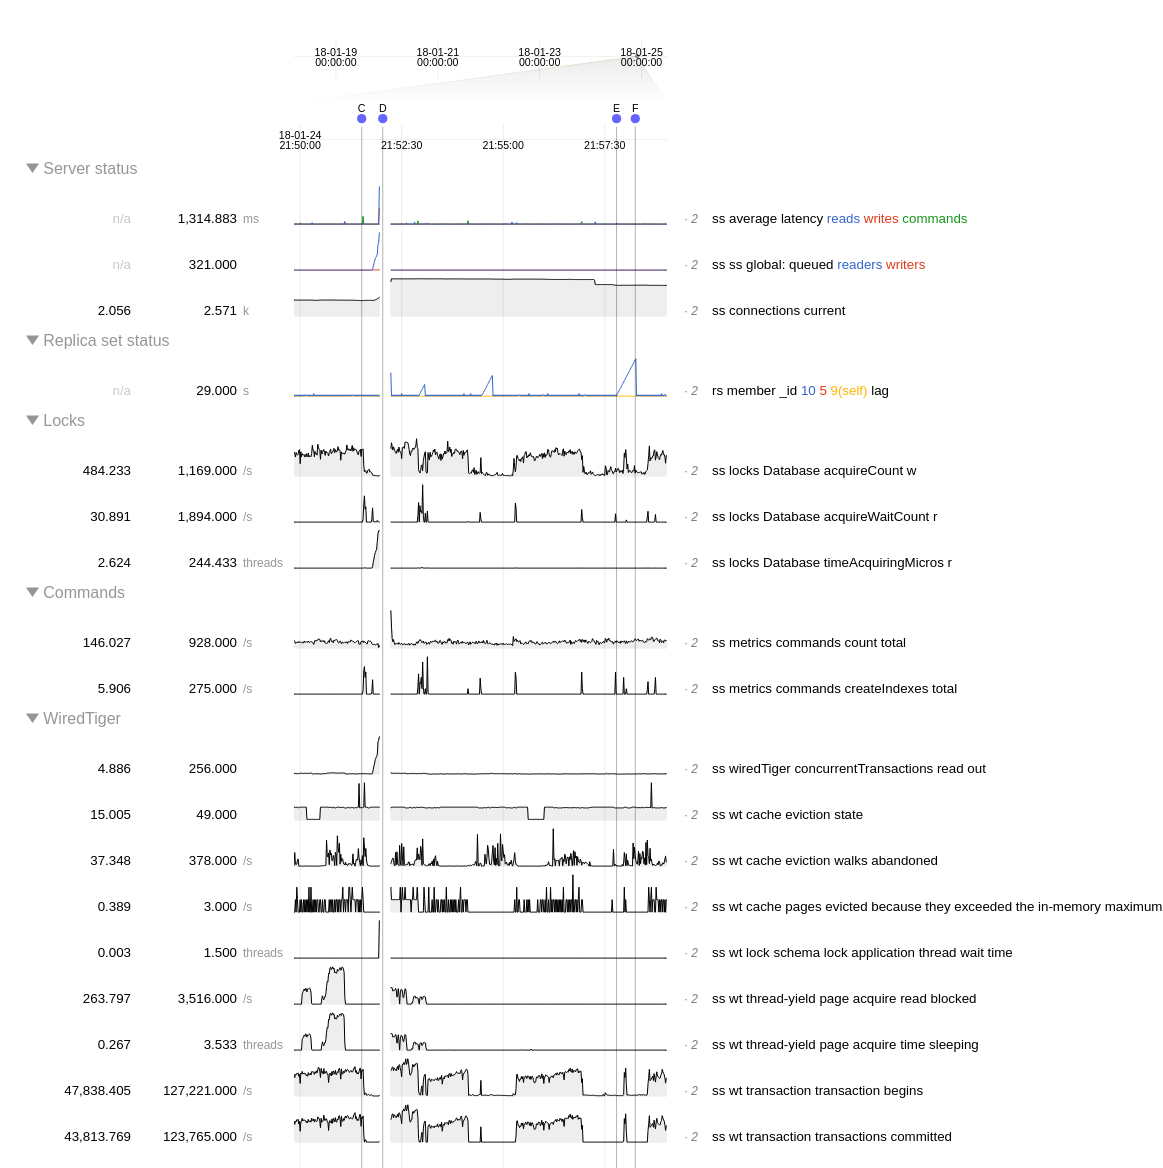
The problem is that basically some operation (we recently reproduced it with index creation but also got the same impact with a collection drop) simply blocks the whole server during 10-30 seconds for no apparent reason. The CPU/RAM/IO are fine, and the query is not even reported as taking time in the slow query log. It seems like the server is doing something internally which takes times (maybe eviction, checkpoint, or whatever) and when this falls during a query which needs a global lock (even for a short time) it can hold this lock for way longer than expected.
I captured everything I could, here is what I have:
Yesterday night (when the load is low) I created about 200 indexes (in background) on existing collections (one after the other), and some of them blocked the DB for 10-30 seconds (about 10) and the rest didn't have any impact. It is not related to the index size, as the big ones did not necessarily had more change to lock, the one I caught were mostly small indexes.
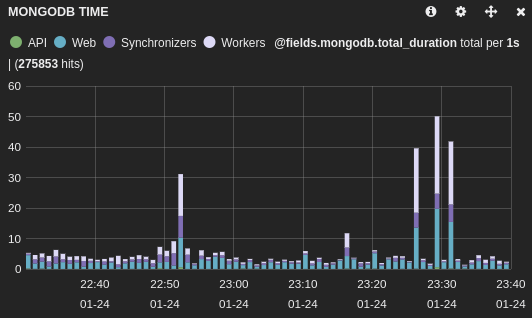
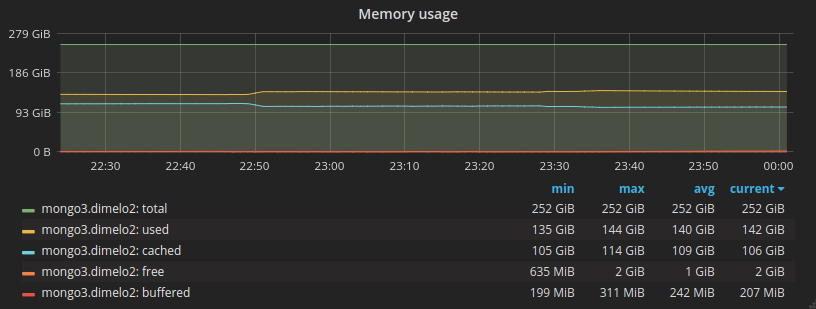
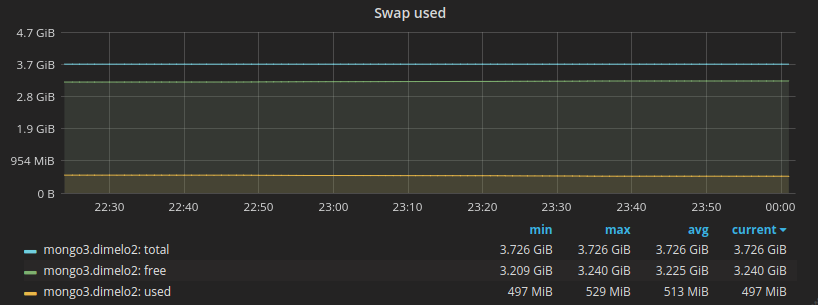
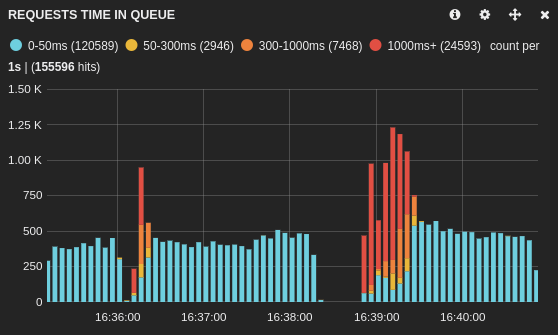
Here is the impact on the main application (database1):
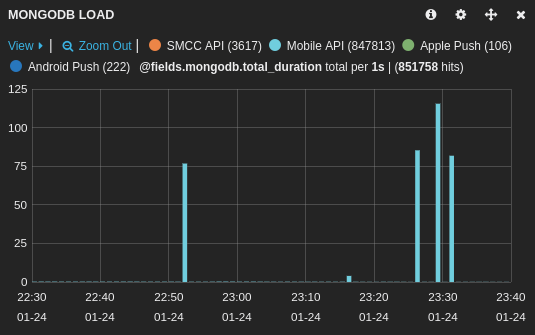
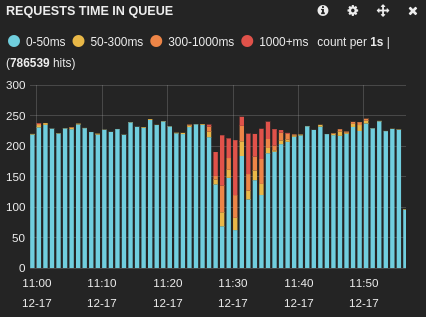
And on another application using a different database (database2):
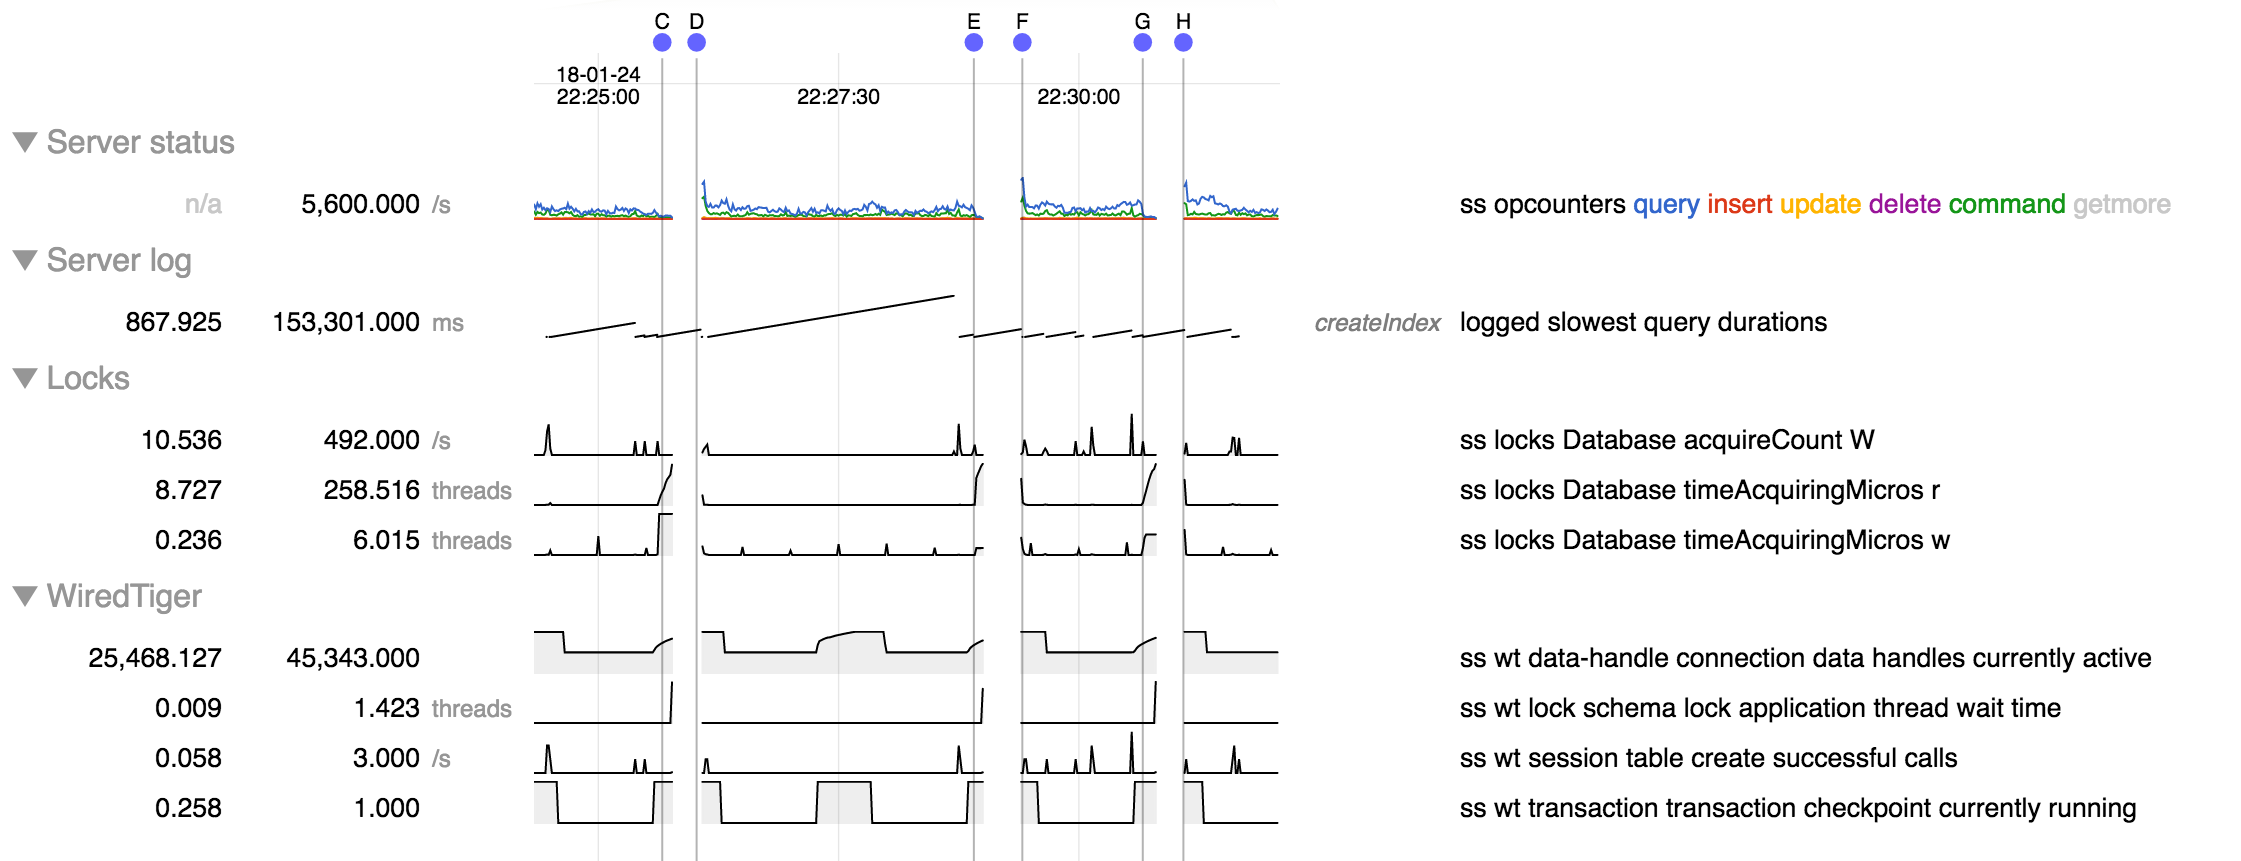
Here is an example of mongo log:
2018-01-24T23:16:25.005+0100 I -        [conn44444622]   Index Build (background): 3644200/3696664 98%
2018-01-24T23:16:25.701+0100 I INDEX    [conn44444622] build index done.  scanned 3696664 total records. 69 secs
2018-01-24T23:16:25.712+0100 I COMMAND  [conn44444622] command database1.$cmd command: createIndexes { createIndexes: "collection1", indexes: [ { key: { updated_at: 1 }, background: true, name: "updated_at_1" } ] } numYields:29161 reslen:113 locks:{ Global: { acquireCount: { r: 29163, w: 29163 } }, Database: { acquireCount: { w: 29163, W: 2 }, acquireWaitCount: { w: 2, W: 2 }, timeAcquiringMicros: { w: 548708, W: 11723 } }, Collection: { acquireCount: { w: 29162 } }, Metadata: { acquireCount: { w: 1 } }, oplog: { acquireCount: { w: 1 } } } protocol:op_query 69394ms

2018-01-24T23:16:25.774+0100 I COMMAND  [conn44444051] command database1.collection3 command: find { find: "collection3", filter: { source_id: { $in: [ ObjectId('50e160a0a90ffbe65700b488') ] } }, limit: 50, skip: 317700, sort: { created_at: 1 } } planSummary: IXSCAN { source_id: 1, created_at: -1 } keysExamined:317712 docsExamined:317712 cursorExhausted:1 numYields:2483 nreturned:12 reslen:30521 locks:{ Global: { acquireCount: { r: 4968 } }, Database: { acquireCount: { r: 2484 }, acquireWaitCount: { r: 41 }, timeAcquiringMicros: { r: 17054 } }, Collection: { acquireCount: { r: 2484 } } } protocol:op_query 537ms

2018-01-24T23:16:39.329+0100 I INDEX    [conn44444622] build index on: database1.collection2 properties: { v: 1, key: { updated_at: 1 }, name: "updated_at_1", ns: "database1.collection2", background: true }

2018-01-24T23:16:39.331+0100 I COMMAND  [conn44449316] command database2.collection1 command: find { find: "collection1", filter: { api_key: "xxxxxxxxxxxxxxxx" } } planSummary: IXSCAN { api_key: 1 } keysExamined:1 docsExamined:1 cursorExhausted:1 numYields:0 nreturned:1 reslen:4910 locks:{ Global: { acquireCount: { r: 2 } }, Database: { acquireCount: { r: 1 } }, Collection: { acquireCount: { r: 1 } } } protocol:op_query 3359ms

/// A lot of queries which were blocked finished here

2018-01-24T23:16:42.004+0100 I -        [conn44444622]   Index Build (background): 213300/219823 97%
2018-01-24T23:16:42.068+0100 I INDEX    [conn44444622] build index done.  scanned 219823 total records. 2 secs
2018-01-24T23:16:42.069+0100 I COMMAND  [conn44444622] command database1.$cmd command: createIndexes { createIndexes: "collection2", indexes: [ { key: { updated_at: 1 }, background: true, name: "updated_at_1" } ] } numYields:1728 reslen:113 locks:{ Global: { acquireCount: { r: 1730, w: 1730 } }, Database: { acquireCount: { w: 1730, W: 2 }, acquireWaitCount: { w: 1, W: 1 }, timeAcquiringMicros: { w: 284059, W: 1071 } }, Collection: { acquireCount: { w: 1729 } }, Metadata: { acquireCount: { w: 1 } }, oplog: { acquireCount: { w: 1 } } } protocol:op_query 16005ms
Here we can see:
- An index build finished on database1.collection1
- An unrelated query
- 14 seconds without a single line (that's when the DB is locked)
- The next index build starts on database1.collection2
- A very simple query which took 3.3s because it was blocked whereas it's not even on the same database!
- Then I removed hundreds of queries in the same situation (basically all of them)
- Then we can see the end of the index creation on database1.collection2 which took 2 seconds
Here is how it looked in mongostat:
insert query update delete getmore command dirty  used flushes vsize  res   qrw   arw net_in net_out conn    set repl                time
     2  1421     48     *0      65   572|0  0.7% 80.0%       0  184G 139G   0|0   2|1   386k   7.82m 1147 dimelo  PRI Jan 24 23:16:00.984
    *0  1201     16     *0      25   358|0  0.7% 80.2%       0  184G 139G   0|0   1|1   277k   5.63m 1158 dimelo  PRI Jan 24 23:16:05.984
     4  1171     36     *0      49   384|0  0.7% 80.1%       0  184G 139G   0|0   1|1   296k   5.35m 1164 dimelo  PRI Jan 24 23:16:10.984
     7  1578     38     *0      56   492|0  0.8% 80.6%       1  184G 139G   0|0   0|1   401k   7.36m 1167 dimelo  PRI Jan 24 23:16:15.985
     9  2407     56      2      72   474|0  0.9% 81.4%       0  184G 139G   0|0   0|2   819k   11.4m 1167 dimelo  PRI Jan 24 23:16:20.984
    18  2132     76      7     108   602|0  0.9% 82.2%       0  184G 139G   0|0   0|0  1.08m   12.2m 1167 dimelo  PRI Jan 24 23:16:25.984
     1   343      9     *0      14   212|0  1.0% 82.2%       0  184G 139G   0|0  85|6   101k    941k 1220 dimelo  PRI Jan 24 23:16:30.984
    *0   330      4     *0       9   182|0  1.0% 82.2%       0  184G 139G  10|0 256|6  86.5k    766k 1321 dimelo  PRI Jan 24 23:16:35.984
    12  1184     36     *0      44   746|0  0.8% 80.3%       0  185G 139G   0|0   3|1   350k   9.67m 2015 dimelo  PRI Jan 24 23:16:40.984
    24  1712    114      2     133   792|0  0.5% 80.0%       0  185G 139G   0|0   3|1   696k   15.6m 2016 dimelo  PRI Jan 24 23:16:45.983
Here we can see the number or active read rising to 256 before starting to queue some, and the number of queries dropping to 0, during the blocking time.
I also ran a periodic db.currentOp() every 5 seconds in a file to make sure to capture the exact state in which the requests were during the lock. I can upload complete version to your private portal if you need but here's the interesting part:
{
  "desc" : "conn44444622",
  "threadId" : "140407966885632",
  "connectionId" : 44444622,
  "client" : "10.10.11.31:39368",
  "active" : true,
  "opid" : -935082558,
  "secs_running" : 9,
  "microsecs_running" : NumberLong(9571622),
  "op" : "command",
  "ns" : "database1.$cmd",
  "query" : {
    "createIndexes" : "collection2",
    "indexes" : [
      {
        "key" : {
          "updated_at" : 1
        },
        "background" : true,
        "name" : "updated_at_1"
      }
    ]
  },
  "numYields" : 0,
  "locks" : {
    "Global" : "w",
    "Database" : "W"
  },
  "waitingForLock" : false,
  "lockStats" : {
    "Global" : {
      "acquireCount" : {
        "r" : NumberLong(1),
        "w" : NumberLong(1)
      }
    },
    "Database" : {
      "acquireCount" : {
        "W" : NumberLong(1)
      }
    }
  }
},
At about 23:16:36+0100 we can see the query is still holding a database write exclusive lock, for more than 9 seconds now, without a single yield. It seem the global lock is only an intent write lock so I'm not sure if this can work concurrently but queries on other DBs seemed blocked too as you can see in the mongo log.
Of course all other queries visible in the currentOp are "waitingForLock" : true for between 0 and 9 seconds.
5 seconds later (about 23:16:41) we can see the index has now started being built in background for real this time and is not longer holding a write exclusive lock and is yielding this time:
{
  "desc" : "conn44444622",
  "threadId" : "140407966885632",
  "connectionId" : 44444622,
  "client" : "10.10.11.31:39368",
  "active" : true,
  "opid" : -935082558,
  "secs_running" : 14,
  "microsecs_running" : NumberLong(14732154),
  "op" : "command",
  "ns" : "database1.$cmd",
  "query" : {
    "createIndexes" : "collection2",
    "indexes" : [
      {
        "key" : {
          "updated_at" : 1
        },
        "background" : true,
        "name" : "updated_at_1"
      }
    ]
  },
  "msg" : "Index Build (background) Index Build (background): 107726/219823 49%",
  "progress" : {
    "done" : 107727,
    "total" : 219823
  },
  "numYields" : 846,
  "locks" : {
    "Global" : "w",
    "Database" : "w",
    "Collection" : "w"
  },
  "waitingForLock" : false,
  "lockStats" : {
    "Global" : {
      "acquireCount" : {
        "r" : NumberLong(847),
        "w" : NumberLong(847)
      }
    },
    "Database" : {
      "acquireCount" : {
        "w" : NumberLong(847),
        "W" : NumberLong(1)
      },
      "acquireWaitCount" : {
        "w" : NumberLong(1)
      },
      "timeAcquiringMicros" : {
        "w" : NumberLong(284059)
      }
    },
    "Collection" : {
      "acquireCount" : {
        "w" : NumberLong(847)
      }
    }
  }
},
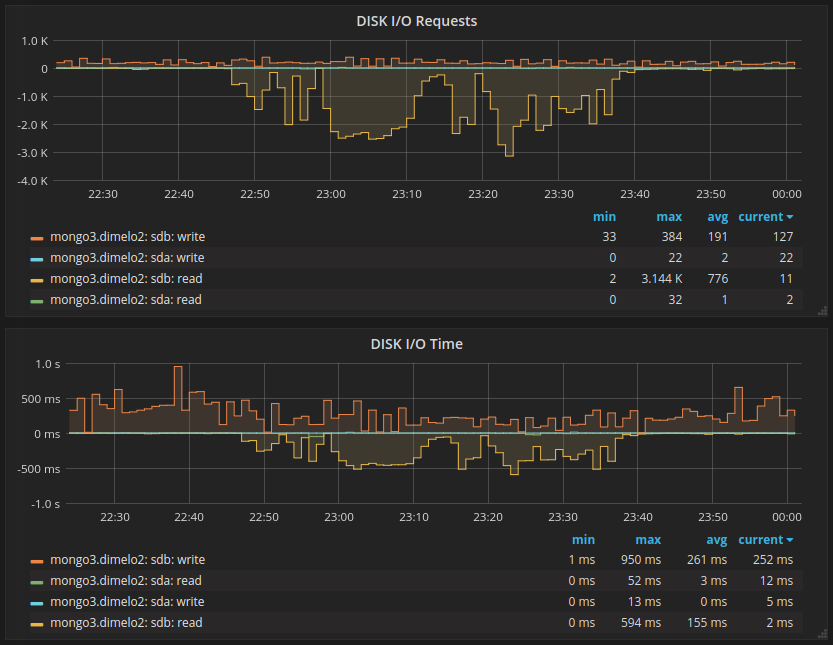
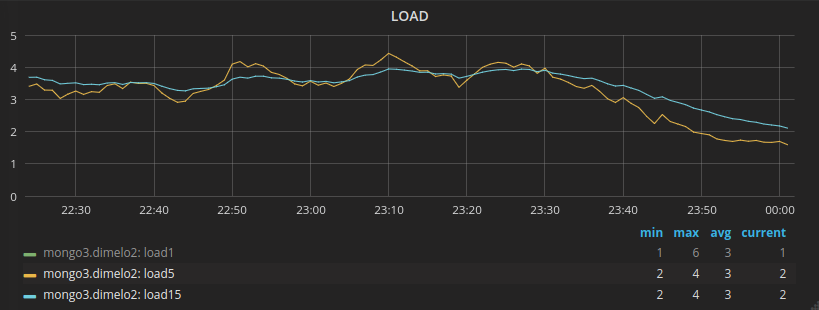
Of course this 15sec delay (sometimes 30sec) can't be explained by slow IO as we're running on a healthy Raid 10 of 4 × 600G SSD. The IO usage on the machine is between 0 an 1%. We do have a lot of collections though, so it maybe be related to the work WT has to do when creating/removing namespace as we seems to encounter the issue on index/collection creation/deletion.
I have extracted the diagnostic.data dir and can upload it to your portal if you want of course.
For the record we had the same issue again today at 12:30 (+0100) where a new index created in background on a empty collection caused a 16s global lock:
2018-01-25T12:30:11.582+0100 I COMMAND  [conn44523028] command database1 ...(last working query)... protocol:op_query 111ms

2018-01-25T12:30:27.255+0100 I INDEX    [conn44531041] build index on: database1.collection4 properties: { v: 1, key: { installation_id: 1, created_at: 1 }, name: "installation_id_1_created_at_1", ns: "database1.collection4" }
2018-01-25T12:30:27.256+0100 I INDEX    [conn44531041]   building index using bulk method; build may temporarily use up to 500 megabytes of RAM
2018-01-25T12:30:27.265+0100 I INDEX    [conn44531041] build index done.  scanned 0 total records. 0 secs


- is related to
-
-
- Closed
-
- related to
-
-
- Closed
-