-
Type:
Bug
-
Resolution: Done
-
Priority:
Major - P3
-
None
-
Affects Version/s: 3.6.3
-
Component/s: WiredTiger
-
None
-
ALL
-
None
-
None
-
None
-
None
-
None
-
None
-
None
First, excuse me for non informative description ![]() Issue happens not often, so I didn't collect more information.
Issue happens not often, so I didn't collect more information.
During some dumb testing following weird behaviour were observed:
- test configuration:
- aws i3.2xlarge (2TB NVMe), ubuntu 14.04, mongodb 3.6.3
- table with 3 fields:
{_id: <blob>, touch: <timestamp>, kv: <map<string,blob>>}with tts index on touch with expireAfterSeconds: 12hours .
- "Upsertion" with
db.ctx.update({_id: <id>}, {$set: {"kv.<key>": <value>, "touch": <now>}}), <value> blobs are near 512bytes (msgpack coded structure), <id> is near 40 bytes and highly random.
- Upsertion are in two streams: first is ingesting huge set of records, so it is at high speed (~12k per second), and second is replicating commands (~2k per second)
- At the same time, documents are randomly requested by _id (from same stream of replicated commands, with rate ~10k per second)
- weird behaviour:
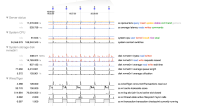
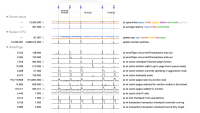
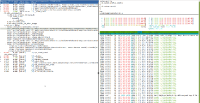
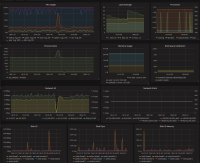
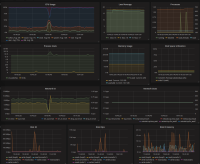
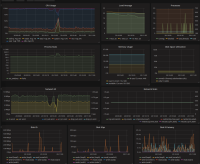
- At some rare case mongo starts to consume a lot of System CPU (instead of User). strace showed a lot of call to '__sched_yield' system call. Number of context switches jumps to 3 millions per second instead of 80 thousands in usual.
- First time it happend when on-disk database size reaches 64GB.
- Currently, after couple of days, on-disk size is 234GB, and ingestion finished. Size of data starts to decrease (because of expiring), and this behavior occurs more often.
(Picture with process stat are from time when ingestion stops. "perf top" screenshot from time when I first encounter behaviour).
