-
Type:
Bug
-
Resolution: Done
-
Priority:
Major - P3
-
None
-
Affects Version/s: 3.6.2
-
Component/s: None
-
None
-
ALL
-
None
-
None
-
None
-
None
-
None
-
None
-
None
Last Friday, we encountered an issue around 07:20 UTC (16:20 JST).
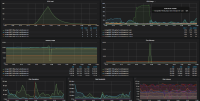
The CPU usage of one of the member of our replica set jumped to 100%, and the queries were not evenly distributed between our servers, causing our application to be unavailable.
We would like to have assistance from the MongoDB team to help:
- finding the root cause of the CPU spike;
- finding why queries are not evenly distributed between the secondaries;
- preventing this situation to happen again.
At the time of incident, the primary server was mongodb001-0305.prd.jp1.aws.kkvesper.net, the affected secondary was mongodb001-005a.prd.jp1.aws.kkvesper.net and mongodb001-0c50.prd.jp1.aws.kkvesper.net was an unaffected secondary.
We are using MongoDB 3.6.2 with mongoid 3.1.6. The replica set has 3 members connected to the application and one hidden secondary used for backups.
I'm attaching the logs of all servers and the content of the diagnostic.data folder for the time around the incident.
We believe the high CPU was caused by a query using the wrong index (see mongodb_parsed_005a_2018042007.log at 2018-04-20T07:18:19.692Z).
The query used a compound index instead of the `_id` index, causing the query to examine over 4M keys.
The CPU usage started to increase soon after the query started, and went down only when we manually restarted the MongoDB server. While the query took 5 minutes, we can see that the high CPU usage lasted more than that.
Using mlogvis, it seems a lot of queries were still running when the server has been restarted and that most of the slow queries are those ones.
With mloginfo, I can see there are more queries run on the affected secondaries than on the other servers. Is it an issue with mongoid or the server? I would expect all secondaries to receive the same amount of queries.
Please provide guidance to analyse this issue and prevent it to happen again.
Thank you.
