Uploaded image for project: 'Core Server'
  1. Core Server
  2. SERVER-35543

Secondary server got frozen with 100% CPU

    • Type: Icon: Bug Bug
    • Resolution: Gone away
    • Priority: Icon: Major - P3 Major - P3
    • None
    • Affects Version/s: 3.6.2
    • Component/s: None
    • Labels:
      None
    • Environment:
      CentOS 7
    • ALL
    • Hide

      It has happened randomly, around 3 times in last 3 weeks: first two with a few hours difference, and on different servers (and I think it happened to primaries at that time), and then now again in a secondary.

      Show
      It has happened randomly, around 3 times in last 3 weeks: first two with a few hours difference, and on different servers (and I think it happened to primaries at that time), and then now again in a secondary.

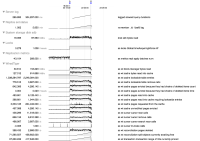
      We have a sharding cluster DB, with 8 shards and each of them using two replica sets + arbiter. Today we had a problem in one of the secondaries server: it suddenly started to use 100% CPU, and did not respond to any query. It remained in that state until restarted.

      I'm attaching stack trace from "pstack" in case it helps, it seems most threads are waiting for a lock, except some of them which might be hoarding the locks while consuming all CPU (this server has 2 CPUs): Threads 70, 73 and 83
        1. incident.png
          incident.png
          467 kB
        2. pstack-03a.txt
          519 kB
        3. pstack-03b.txt
          255 kB

            Assignee:
            bruce.lucas@mongodb.com Bruce Lucas (Inactive)
            Reporter:
            icruz Isaac Cruz
            Votes:
            0 Vote for this issue
            Watchers:
            12 Start watching this issue

              Created:
              Updated:
              Resolved: