-
Type:
Question
-
Resolution: Unresolved
-
Priority:
 Major - P3
-
None
-
Affects Version/s: 3.6.6
-
Component/s: Performance
-
Query Execution
-
None
-
None
-
None
-
None
-
None
-
None
-
None
We've noticed increased mongod CPU usage when trying to watch change streams.
One of our microservices tracks changes on 6 specially prepared collections and notifies clients when change occures. Service implemented in python (Pymongo 3.7.1). Part of relevant code below
    def watch_waiter(self, coll, queue):
        """
        Waiter thread tracking mongo's ChangeStream
        :param coll:
        :param queue:
        :return:
        """
        while True:
            with coll.watch(pipeline=[{"$project": {"_id": 1}}]) as stream:
                try:
                    for _ in stream:
                        # Change received, call all pending callback
                        self._run_callbacks(queue)
                except pymongo.errors.PyMongoError as e:
                    self.logger.error("Unrecoverable watch error: %s", e)
                    time.sleep(1)
Each service starts separate thread per each change stream (6 in total), we have total of 3 services in our cluster.
Tracked collections are relatively rarely changed (100-1000 changes per day).
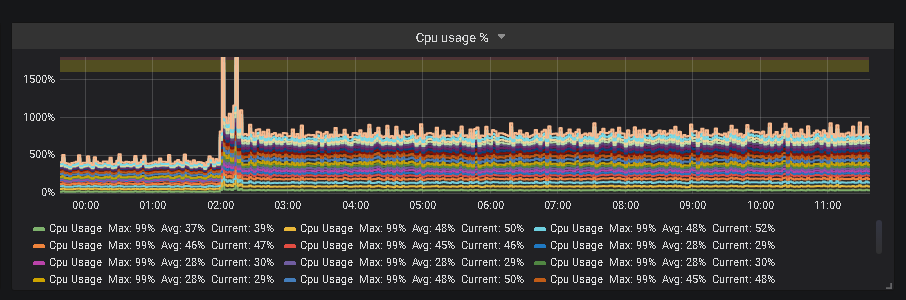
Setup works as expected on single-node replica set. When trying to deploy on 3-node replica set we observing additional significant CPU consuming by mongod service. Our service remains fully functional and works as expected.
mongod CPU usage chart is attached.
mongod also reports slow getMore operations on tracked collections
авг 24 05:25:27 ddb03fm mongod.27017[1958]: [conn87463] command sova.ds_managedobject command: getMore { getMore: 7824301615466829785, collection: "ds_managedobject", lsid: { id: UUID("0814702b-262e-48e7-9ae5-09a68a1560fd") }, $clusterTime: { clusterTime: Timestamp(1535052326, 131), signature: { keyId: 6590282739075777080, hash: BinData(0, D233053EEFA7C58E0DD1AE898977806564882F53) } }, $db: "sova", $readPreference: { mode: "primary" } } originatingCommand: { aggregate: "ds_managedobject", pipeline: [ { $changeStream: { fullDocument: "default" } }, { $project: { _id: 1 } } ], cursor: {}, lsid: { id: UUID("0814702b-262e-48e7-9ae5-09a68a1560fd") }, $clusterTime: { clusterTime: Timestamp(1535052160, 573), signature: { keyId: 6590282739075777080, hash: BinData(0, 52ED832339DA7BC72BAEA5CAB7C989E5B130A3DA) } }, $db: "sova", $readPreference: { mode: "primary" } } planSummary: COLLSCAN cursorid:7824301615466829785 keysExamined:0 docsExamined:822 numYields:2485 nreturned:0 reslen:218 locks:{ Global: { acquireCount: { r: 4974 } }, Database: { acquireCount: { r: 2487 } }, oplog: { acquireCount: { r: 2486 } } } protocol:op_msg 100ms
Altering pipeline options (including empty pipelines) leads to no visible effect.
We've replaced our waiter thread with simple poller
    def sleep_waiter(self, coll, queue):
        """
        Simple timeout waiter
        :param coll:
        :param queue:
        :return:
        """
        TIMEOUT = 60
        JITER = 0.1
        while True:
            # Sleep timeout is random of [TIMEOUT - TIMEOUT * JITTER, TIMEOUT + TIMEOUT * JITTER]
            time.sleep(TIMEOUT + (random.random() - 0.5) * TIMEOUT * 2 * JITER)
            self._run_callbacks(queue)
and observed CPU usage dropped to usual levels.
Is this expected behaviour? How can we estimate change streams watching penalty?

- is related to
-
SERVER-42885 Registering multiple change stream watchers over single db connection
-
- Needs Scheduling
-