-
Type:
Bug
-
Resolution: Done
-
Priority:
 Minor - P4
-
None
-
Affects Version/s: 4.0.4
-
Component/s: None
-
None
-
None
-
None
-
None
-
None
-
None
-
None
-
None
I have 2 servers running in a replica set. Recently I had some issues with the primary one, and whole replica has been reconfigured, but the primary one stayed on its original place.
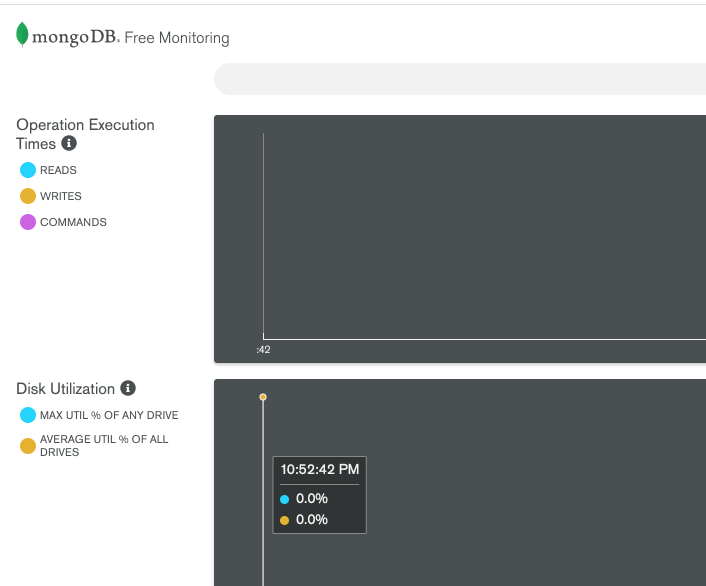
After I've added one server to the set, Free Monitoring started to show "blank graphs" like these:

Disabling and enabling monitoring does not help much.
I've noticed also that on restarting the primary, there were some data in a new graph related to a secondary server. However once primary back online graph related to secondary disappeared, and the blank one, without data, back again.
Is there anything I could try to safely remove Free Monitoring related data to try to set it up from scratch?