Uploaded image for project: 'Core Server'
  1. Core Server
  2. SERVER-40595

memory usage saturation

    • Type: Icon: Bug Bug
    • Resolution: Done
    • Priority: Icon: Major - P3 Major - P3
    • None
    • Affects Version/s: 3.6.10
    • Component/s: WiredTiger
    • Labels:
      None
    • ALL

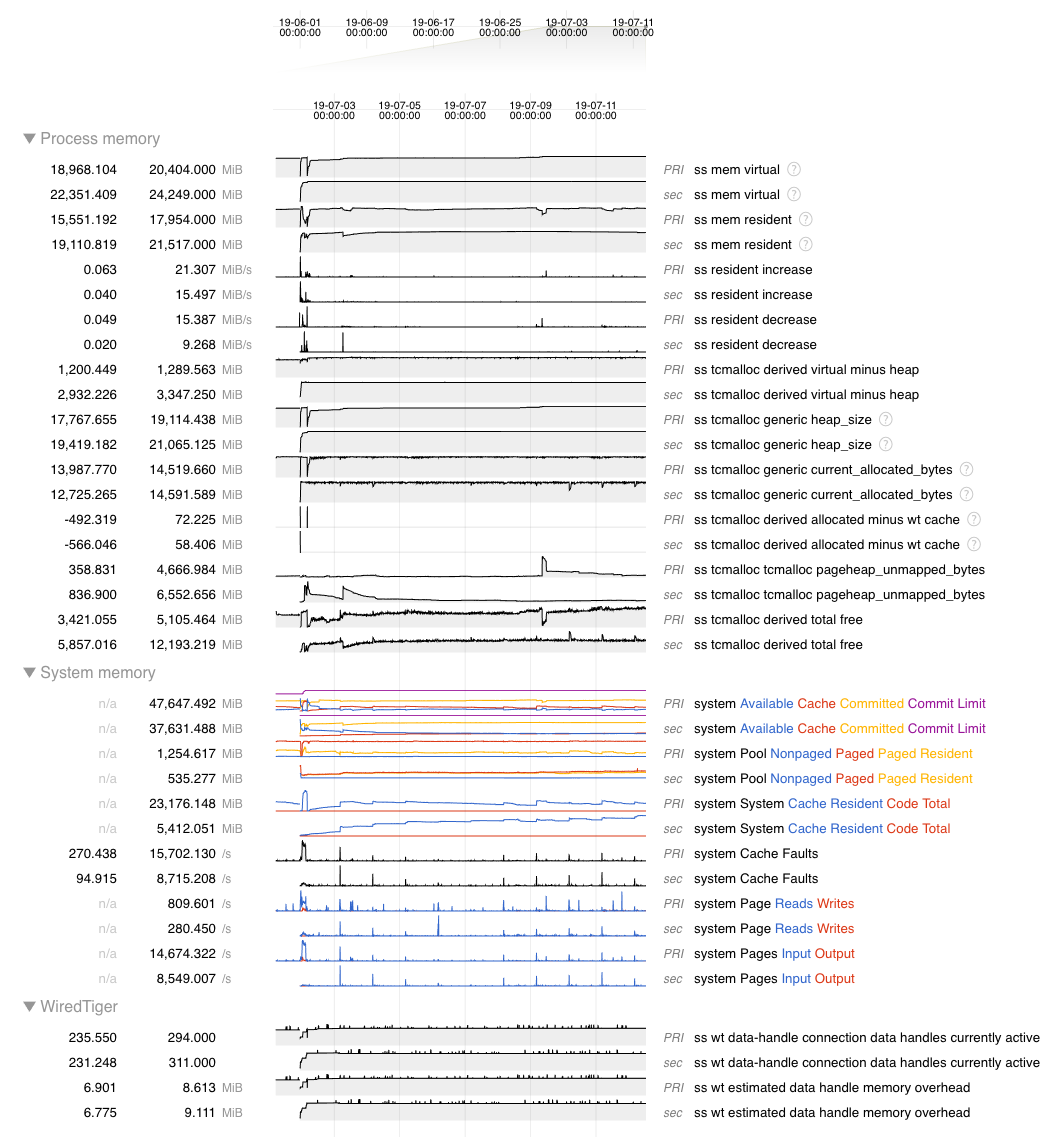
      We had a production system that has been working fine slow to a crawl and kick users out after the memory usage grew to 99% overall. 

      We are currently on 3.6.10 

      Single server, no replica set

      Config has wiredTiger.cacheSizeGB: 13

      Total system memory is 24gb

      values reported by mongostat were

      vsize  40gb

      res was 19

      dirty .8%

      used 80%

      I have the metrics files from the diagnostic.data for the time frame, are there tools available yet so I can analyze these?

        1. Screen Shot 2019-06-06 at 11.38.22 AM.png
          151 kB
          Eric Sedor
        2. Screen Shot 2019-06-06 at 11.41.14 AM.png
          45 kB
          Eric Sedor
        3. Screen Shot 2019-06-06 at 11.42.27 AM.png
          190 kB
          Eric Sedor
        4. Screen Shot 2019-07-16 at 11.25.29 AM.png
          271 kB
          Eric Sedor

            Assignee:
            daniel.hatcher@mongodb.com Danny Hatcher (Inactive)
            Reporter:
            mhughes Matt Hughes
            Votes:
            0 Vote for this issue
            Watchers:
            7 Start watching this issue

              Created:
              Updated:
              Resolved: