-
Type:
Bug
-
Resolution: Incomplete
-
Priority:
 Major - P3
-
None
-
Affects Version/s: 3.4.16
-
Component/s: Performance, Stability
-
None
-
Fully Compatible
-
ALL
-
None
-
None
-
None
-
None
-
None
-
None
-
None
Hello,
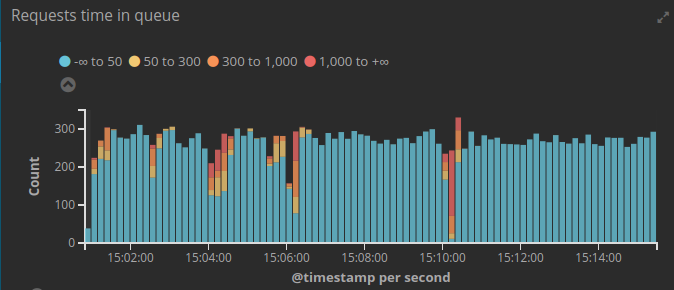
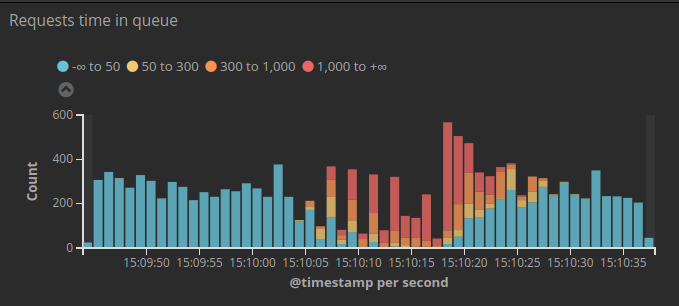
We're having some trouble on our current production servers with a lot logs lines like this one:
2019-07-03T06:40:05.648+0200 I COMMAND  [ftdc] serverStatus was very slow: { after basic: 0, after asserts: 0, after backgroundFlushing: 0, after connections: 0, after dur: 0, after extra_info: 0, after globalLock: 10, after locks: 10, after network: 10, after opLatencies: 10, after opcounters: 10, after opcountersRepl: 10, after repl: 10, after security: 10, after storageEngine: 10, after tcmalloc: 1645, after wiredTiger: 1655, at end: 1655 }
2019-07-03T09:10:05.637+0200 I COMMAND  [ftdc] serverStatus was very slow: { after basic: 0, after asserts: 0, after backgroundFlushing: 0, after connections: 0, after dur: 0, after extra_info: 0, after globalLock: 0, after locks: 0, after network: 0, after opLatencies: 0, after opcounters: 0, after opcountersRepl: 0, after repl: 0, after security: 0, after storageEngine: 0, after tcmalloc: 1633, after wiredTiger: 1633, at end: 1643 }
2019-07-03T10:50:05.676+0200 I COMMAND  [ftdc] serverStatus was very slow: { after basic: 0, after asserts: 0, after backgroundFlushing: 0, after connections: 0, after dur: 0, after extra_info: 0, after globalLock: 0, after locks: 0, after network: 0, after opLatencies: 0, after opcounters: 0, after opcountersRepl: 0, after repl: 0, after security: 0, after storageEngine: 0, after tcmalloc: 0, after wiredTiger: 0, at end: 1674 }
2019-07-03T13:00:05.708+0200 I COMMAND  [ftdc] serverStatus was very slow: { after basic: 0, after asserts: 0, after backgroundFlushing: 0, after connections: 0, after dur: 0, after extra_info: 0, after globalLock: 0, after locks: 0, after network: 0, after opLatencies: 0, after opcounters: 0, after opcountersRepl: 0, after repl: 0, after security: 0, after storageEngine: 0, after tcmalloc: 1704, after wiredTiger: 1704, at end: 1714 }
2019-07-03T14:40:10.106+0200 I COMMAND  [ftdc] serverStatus was very slow: { after basic: 0, after asserts: 0, after backgroundFlushing: 0, after connections: 0, after dur: 0, after extra_info: 0, after globalLock: 0, after locks: 0, after network: 0, after opLatencies: 0, after opcounters: 0, after opcountersRepl: 0, after repl: 0, after security: 0, after storageEngine: 0, after tcmalloc: 1098, after wiredTiger: 1098, at end: 1108 }
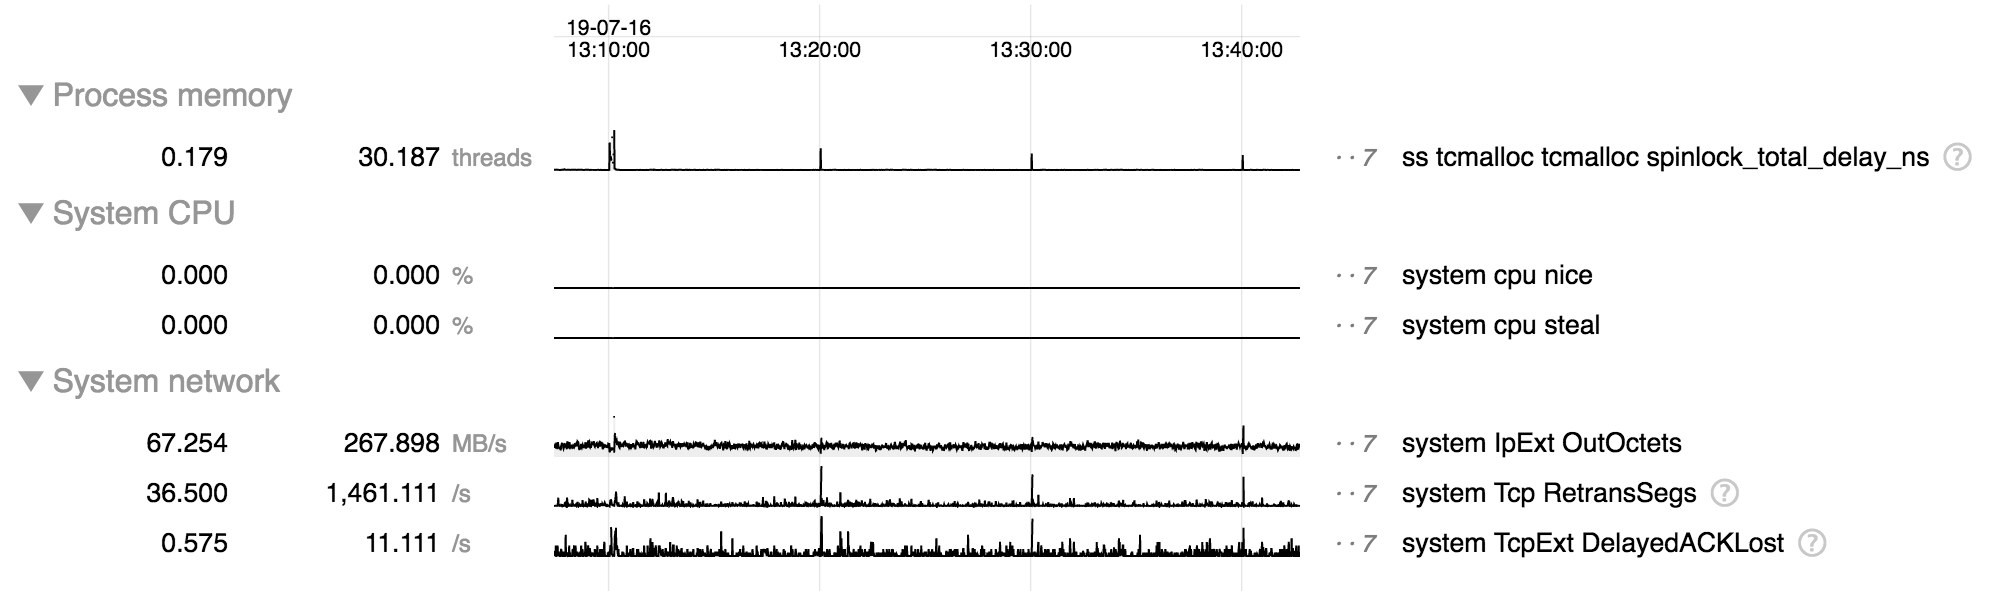
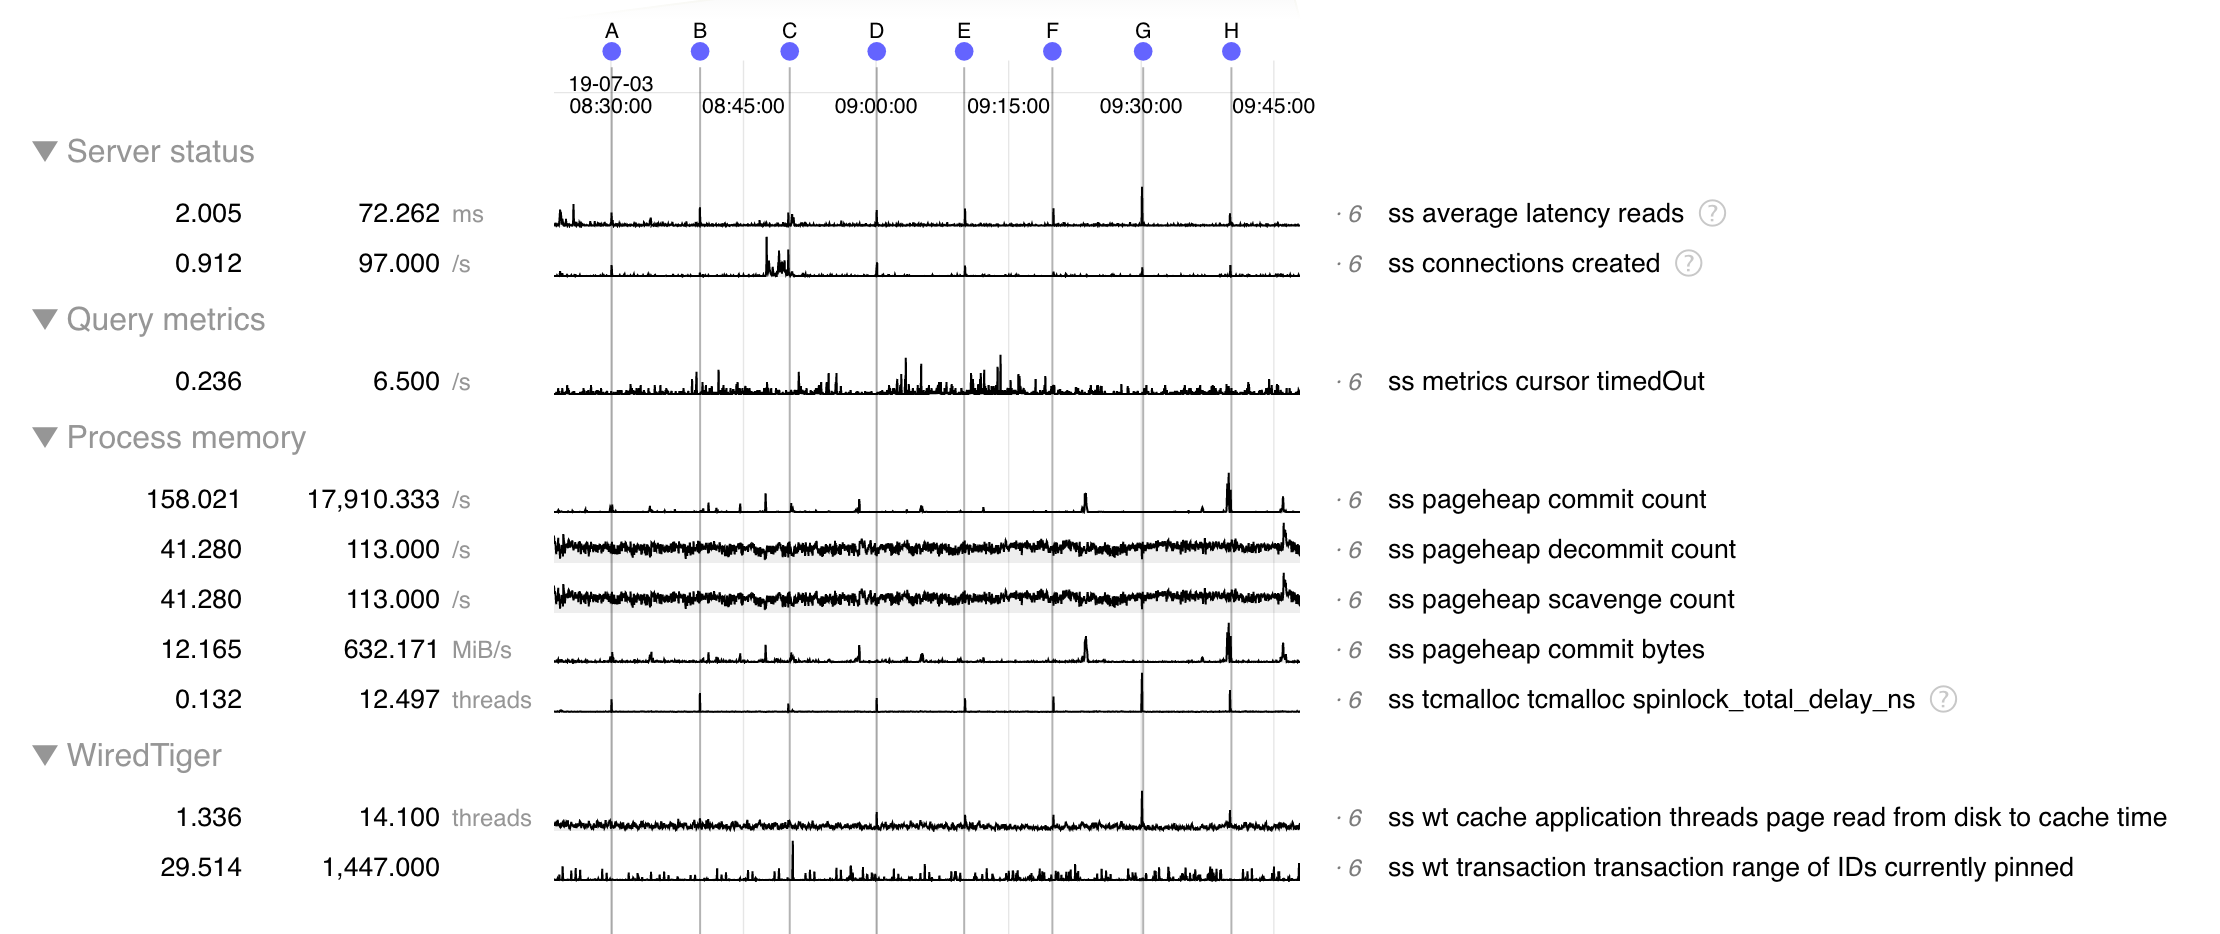
A lot of time seems to be spent in "tcmalloc" FWICS.
We found a lot of tickets with the similar issue:
SERVER-34027
SERVER-31417
SERVER-28712
and this detailed Circle CI postmortem: https://discuss.circleci.com/t/postmortem-march-26-april-10-workflow-delay-incidents/30060
After reading this we tried to have more details about the locks with the serverStatus command, before, during and after the lock:
dimelo_shard:PRIMARY> print(new Date); db.serverStatus().tcmalloc // before
Tue Jul 02 2019 14:40:02 GMT+0200 (CEST)
{
	"generic" : {
		"current_allocated_bytes" : NumberLong("117552083592"),
		"heap_size" : NumberLong("150148108288")
	},
	"tcmalloc" : {
		"pageheap_free_bytes" : NumberLong("18349326336"),
		"pageheap_unmapped_bytes" : NumberLong("11275706368"),
		"max_total_thread_cache_bytes" : NumberLong(1073741824),
		"current_total_thread_cache_bytes" : 130347296,
		"total_free_bytes" : NumberLong("2970869232"),
		"central_cache_free_bytes" : NumberLong("2840585832"),
		"transfer_cache_free_bytes" : 58496,
		"thread_cache_free_bytes" : 130259936,
		"aggressive_memory_decommit" : 0,
		"pageheap_committed_bytes" : NumberLong("138872401920"),
		"pageheap_scavenge_count" : 189129607,
		"pageheap_commit_count" : 295850012,
		"pageheap_total_commit_bytes" : NumberLong("69973171851264"),
		"pageheap_decommit_count" : 189129607,
		"pageheap_total_decommit_bytes" : NumberLong("69834299449344"),
		"pageheap_reserve_count" : 25899,
		"pageheap_total_reserve_bytes" : NumberLong("150148108288"),
		"spinlock_total_delay_ns" : NumberLong("185564381857153"),
		"formattedString" : "------------------------------------------------\nMALLOC:   117585679288 (112138.4 MiB) Bytes in use by application\nMALLOC: +  18315825152 (17467.3 MiB) Bytes in page heap freelist\nMALLOC: +   2840582824 ( 2709.0 MiB) Bytes in central cache freelist\nMALLOC: +        58496 (    0.1 MiB) Bytes in transfer cache freelist\nMALLOC: +    130256160 (  124.2 MiB) Bytes in thread cache freelists\nMALLOC: +    638378240 (  608.8 MiB) Bytes in malloc metadata\nMALLOC:   ------------\nMALLOC: = 139510780160 (133047.8 MiB) Actual memory used (physical + swap)\nMALLOC: +  11275706368 (10753.4 MiB) Bytes released to OS (aka unmapped)\nMALLOC:   ------------\nMALLOC: = 150786486528 (143801.2 MiB) Virtual address space used\nMALLOC:\nMALLOC:        6546367              Spans in use\nMALLOC:           1903              Thread heaps in use\nMALLOC:           4096              Tcmalloc page size\n------------------------------------------------\nCall ReleaseFreeMemory() to release freelist memory to the OS (via madvise()).\nBytes released to the OS take up virtual address space but no physical memory.\n"
	}
}
dimelo_shard:PRIMARY> print(new Date); db.serverStatus().tcmalloc //during
Tue Jul 02 2019 14:40:03 GMT+0200 (CEST)
{
	"generic" : {
		"current_allocated_bytes" : NumberLong("117626126808"),
		"heap_size" : NumberLong("150148108288")
	},
	"tcmalloc" : {
		"pageheap_free_bytes" : NumberLong("18269425664"),
		"pageheap_unmapped_bytes" : NumberLong("11280478208"),
		"max_total_thread_cache_bytes" : NumberLong(1073741824),
		"current_total_thread_cache_bytes" : 131302496,
		"total_free_bytes" : NumberLong("2967829528"),
		"central_cache_free_bytes" : NumberLong("2836261848"),
		"transfer_cache_free_bytes" : 193376,
		"thread_cache_free_bytes" : 131495112,
		"aggressive_memory_decommit" : 0,
		"pageheap_committed_bytes" : NumberLong("138869190656"),
		"pageheap_scavenge_count" : 189129663,
		"pageheap_commit_count" : 295850032,
		"pageheap_total_commit_bytes" : NumberLong("69973182099456"),
		"pageheap_decommit_count" : 189129663,
		"pageheap_total_decommit_bytes" : NumberLong("69834312380416"),
		"pageheap_reserve_count" : 25899,
		"pageheap_total_reserve_bytes" : NumberLong("150148108288"),
		"spinlock_total_delay_ns" : NumberLong("185588157938035"),
		"formattedString" : "------------------------------------------------\nMALLOC:   117631224992 (112181.9 MiB) Bytes in use by application\nMALLOC: +  18270486528 (17424.1 MiB) Bytes in page heap freelist\nMALLOC: +   2836202536 ( 2704.8 MiB) Bytes in central cache freelist\nMALLOC: +       187232 (    0.2 MiB) Bytes in transfer cache freelist\nMALLOC: +    131617752 (  125.5 MiB) Bytes in thread cache freelists\nMALLOC: +    638378240 (  608.8 MiB) Bytes in malloc metadata\nMALLOC:   ------------\nMALLOC: = 139508097280 (133045.3 MiB) Actual memory used (physical + swap)\nMALLOC: +  11278389248 (10755.9 MiB) Bytes released to OS (aka unmapped)\nMALLOC:   ------------\nMALLOC: = 150786486528 (143801.2 MiB) Virtual address space used\nMALLOC:\nMALLOC:        6548780              Spans in use\nMALLOC:           1909              Thread heaps in use\nMALLOC:           4096              Tcmalloc page size\n------------------------------------------------\nCall ReleaseFreeMemory() to release freelist memory to the OS (via madvise()).\nBytes released to the OS take up virtual address space but no physical memory.\n"
	}
}
dimelo_shard:PRIMARY> print(new Date); db.serverStatus().tcmalloc // after
Tue Jul 02 2019 14:40:08 GMT+0200 (CEST)
{
	"generic" : {
		"current_allocated_bytes" : NumberLong("117641336656"),
		"heap_size" : NumberLong("150148108288")
	},
	"tcmalloc" : {
		"pageheap_free_bytes" : NumberLong("18237587456"),
		"pageheap_unmapped_bytes" : NumberLong("11311992832"),
		"max_total_thread_cache_bytes" : NumberLong(1073741824),
		"current_total_thread_cache_bytes" : 132614088,
		"total_free_bytes" : NumberLong("2957264528"),
		"central_cache_free_bytes" : NumberLong("2824540336"),
		"transfer_cache_free_bytes" : 109152,
		"thread_cache_free_bytes" : 132612808,
		"aggressive_memory_decommit" : 0,
		"pageheap_committed_bytes" : NumberLong("138836115456"),
		"pageheap_scavenge_count" : 189129809,
		"pageheap_commit_count" : 295850054,
		"pageheap_total_commit_bytes" : NumberLong("69973193326592"),
		"pageheap_decommit_count" : 189129809,
		"pageheap_total_decommit_bytes" : NumberLong("69834357211136"),
		"pageheap_reserve_count" : 25899,
		"pageheap_total_reserve_bytes" : NumberLong("150148108288"),
		"spinlock_total_delay_ns" : NumberLong("185588613663259"),
		"formattedString" : "------------------------------------------------\nMALLOC:   117641320648 (112191.5 MiB) Bytes in use by application\nMALLOC: +  18237534208 (17392.7 MiB) Bytes in page heap freelist\nMALLOC: +   2824532144 ( 2693.7 MiB) Bytes in central cache freelist\nMALLOC: +       109152 (    0.1 MiB) Bytes in transfer cache freelist\nMALLOC: +    132619304 (  126.5 MiB) Bytes in thread cache freelists\nMALLOC: +    638378240 (  608.8 MiB) Bytes in malloc metadata\nMALLOC:   ------------\nMALLOC: = 139474493696 (133013.2 MiB) Actual memory used (physical + swap)\nMALLOC: +  11311992832 (10788.0 MiB) Bytes released to OS (aka unmapped)\nMALLOC:   ------------\nMALLOC: = 150786486528 (143801.2 MiB) Virtual address space used\nMALLOC:\nMALLOC:        6545889              Spans in use\nMALLOC:           1951              Thread heaps in use\nMALLOC:           4096              Tcmalloc page size\n------------------------------------------------\nCall ReleaseFreeMemory() to release freelist memory to the OS (via madvise()).\nBytes released to the OS take up virtual address space but no physical memory.\n"
	}
}
dimelo_shard:PRIMARY> (after.tcmalloc.spinlock_total_delay_ns - during.tcmalloc.spinlock_total_delay_ns) / (1000*1000*1000)
0.455725224
dimelo_shard:PRIMARY> (during.tcmalloc.spinlock_total_delay_ns - before.tcmalloc.spinlock_total_delay_ns) / (1000*1000*1000)
23.776080882
The last command is showing how much time (~24 seconds) clients have been locked between the before and the after command.
MongoDB version: 3.4.16
I've a diagnostic.data archive to help you debug this if you want.