-
Type:
Bug
-
Resolution: Won't Fix
-
Priority:
 Major - P3
-
None
-
Affects Version/s: 4.0.12
-
Component/s: WiredTiger
-
Environment:Ubuntu 16.04.6 LTS
Linux scorpius 4.15.0-58-generic #64~16.04.1-Ubuntu SMP Wed Aug 7 14:10:35 UTC 2019 x86_64 x86_64 x86_64 GNU/Linux
db version v4.0.12
git version: 5776e3cbf9e7afe86e6b29e22520ffb6766e95d4
OpenSSL version: OpenSSL 1.0.2g 1 Mar 2016
allocator: tcmalloc
modules: none
build environment:
distmod: ubuntu1604
distarch: x86_64
target_arch: x86_64
2xIntel(R) Xeon(R) CPU E5-1650 v4 @ 3.60GHz
total used free shared buff/cache available
Mem: 125G 372M 61G 2.5M 64G 124G
Swap: 29G 0B 29G
Ubuntu 16.04.6 LTS Linux scorpius 4.15.0-58-generic #64~16.04.1-Ubuntu SMP Wed Aug 7 14:10:35 UTC 2019 x86_64 x86_64 x86_64 GNU/Linux db version v4.0.12 git version: 5776e3cbf9e7afe86e6b29e22520ffb6766e95d4 OpenSSL version: OpenSSL 1.0.2g 1 Mar 2016 allocator: tcmalloc modules: none build environment: distmod: ubuntu1604 distarch: x86_64 target_arch: x86_64 2xIntel(R) Xeon(R) CPU E5-1650 v4 @ 3.60GHz total used free shared buff/cache available Mem: 125G 372M 61G 2.5M 64G 124G Swap: 29G 0B 29G
-
Replication
-
ALL
-
None
-
None
-
None
-
None
-
None
-
None
-
None
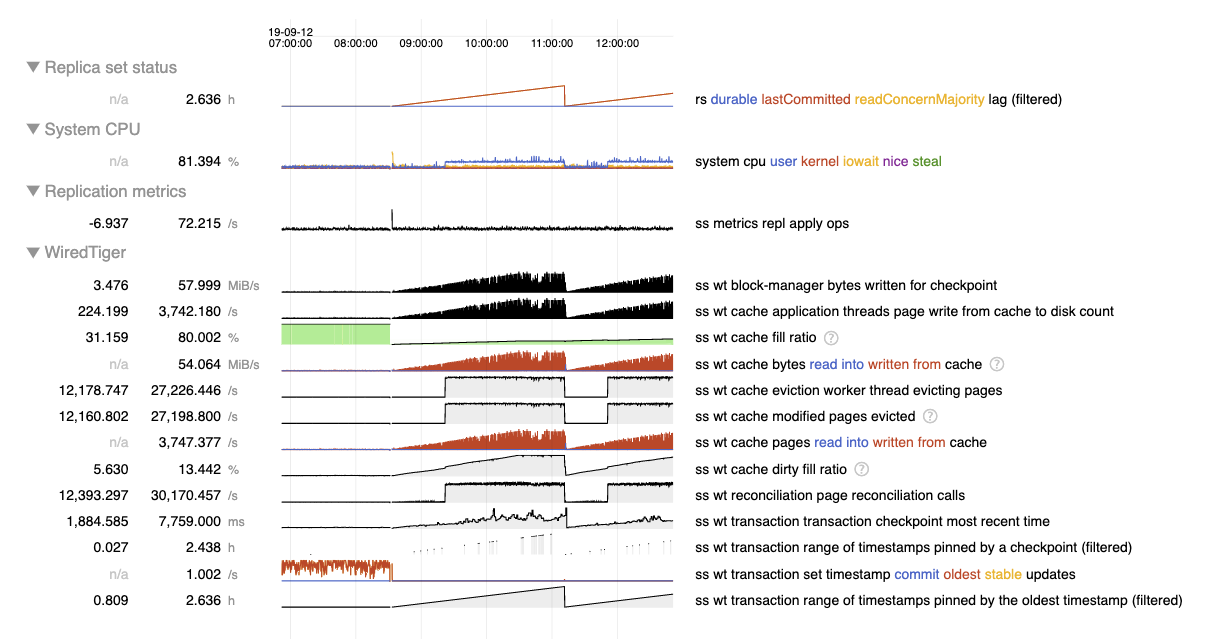
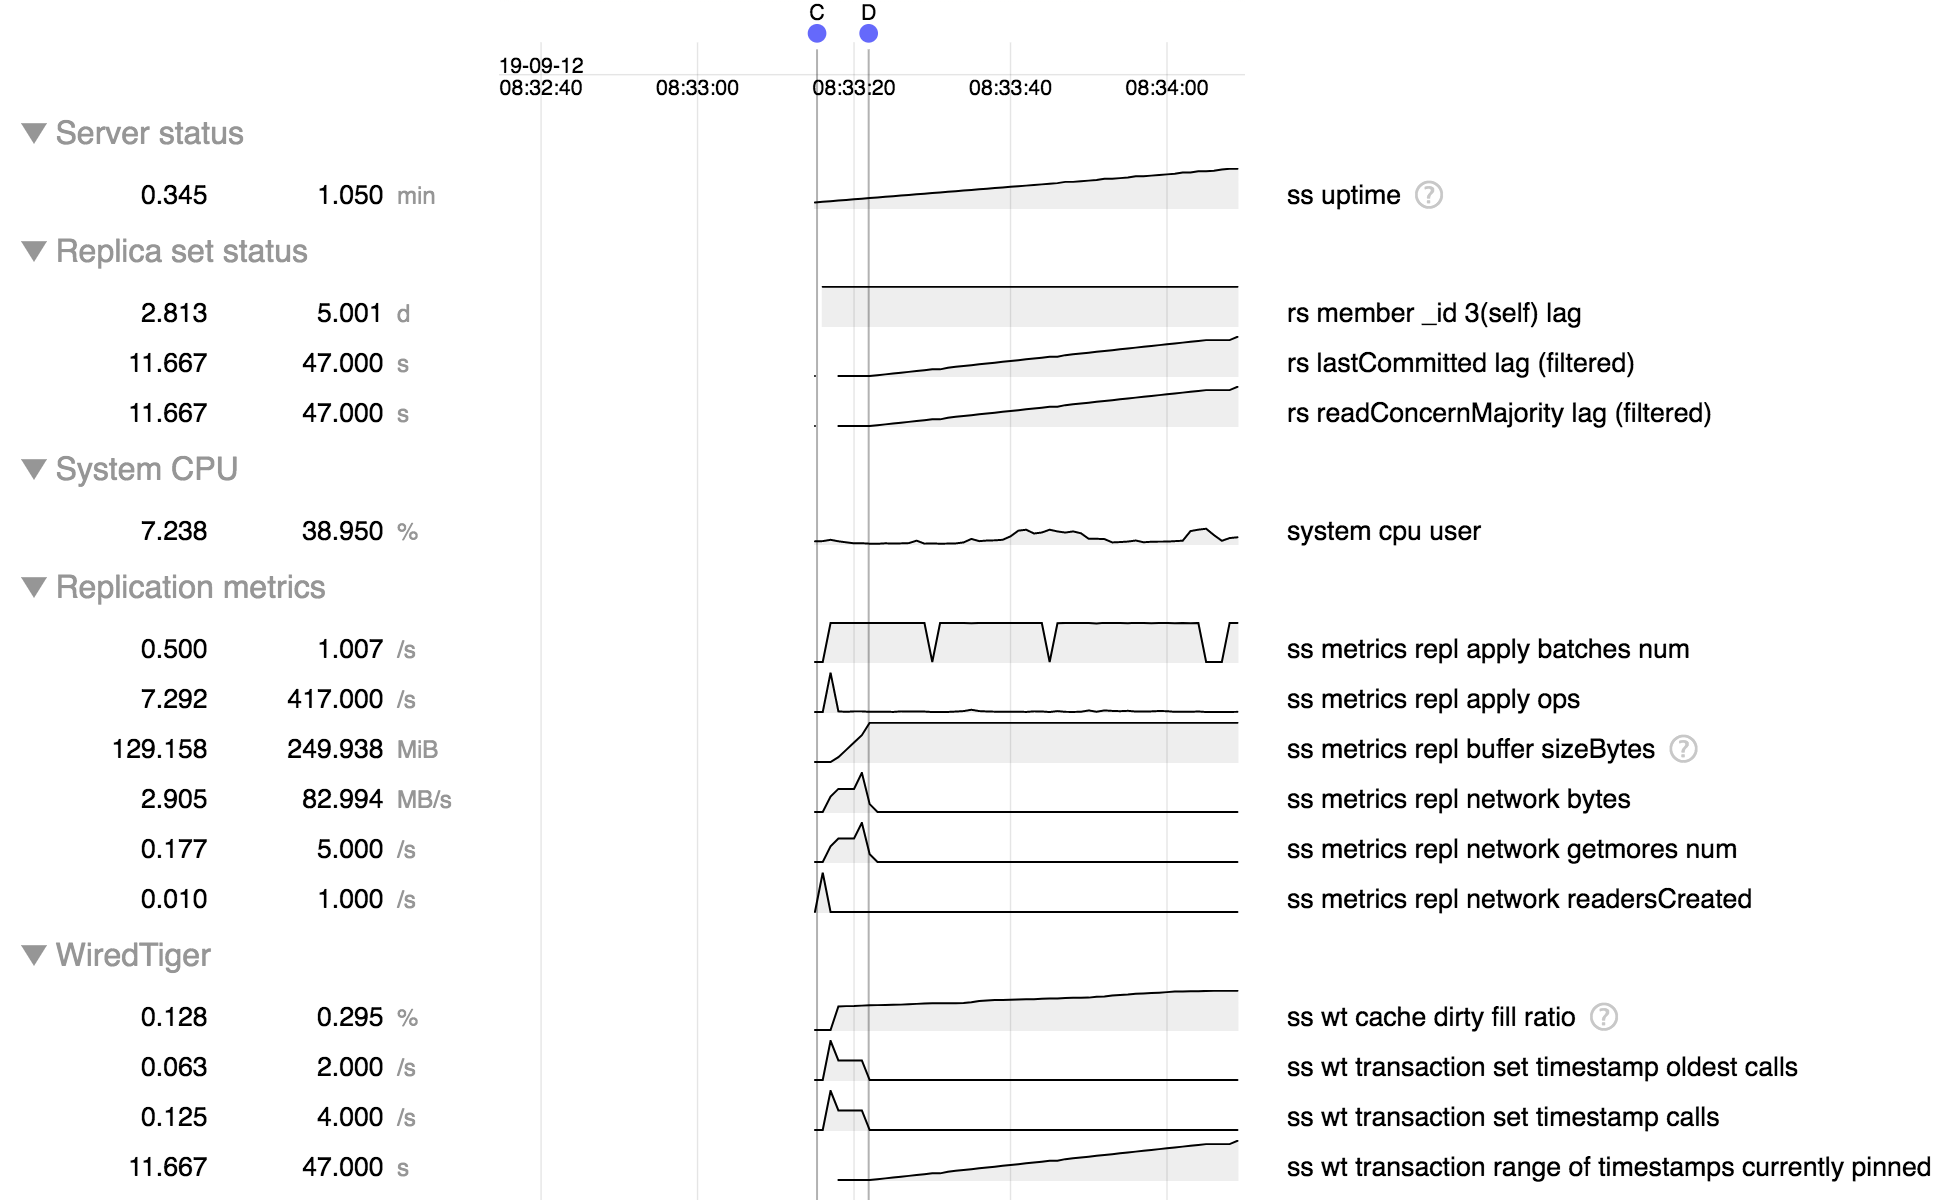
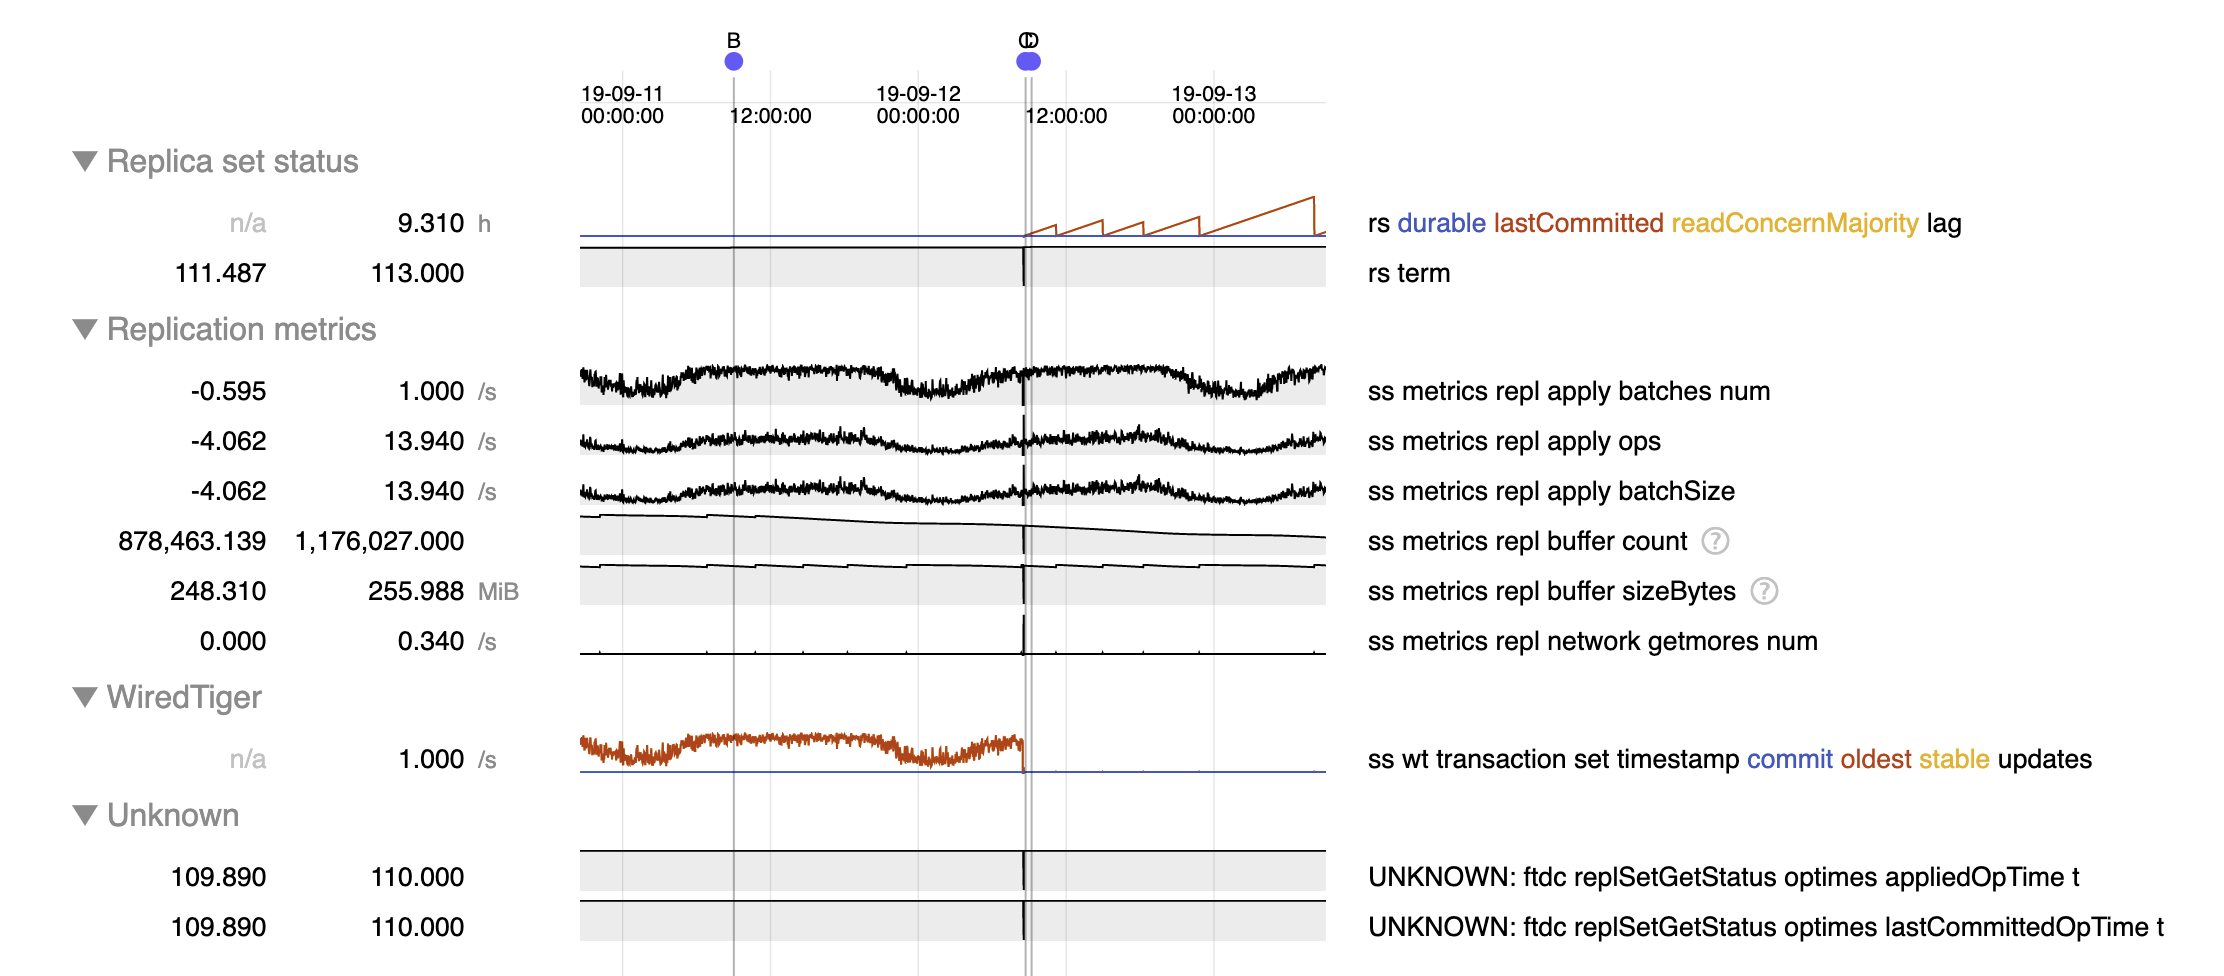
After restarting a stale slaveDelay node, the learned higher OpTime in the same term can be forgotten. If the commit point is in a higher term on all other nodes, the slaveDelay node can only advance its commit point on getMore responses due to SERVER-39831. On slaveDelay nodes, it's likely the buffer is already full, so the applier has to apply 16MB worth of oplog entries to make the room for bgsync to insert the last fetched batch and call another getMore. Applying 16MB oplog entires may be enough to trigger memory pressure, causing evictions.
The issue will resolve when the slaveDelay node starts to apply oplog entries from the latest term. Memory pressure and evictions on slaveDelay nodes are undesired but not harmful.
The same issue can happen without restart. Let's say an election happens in term 8 at time T0, but the node delays by 5 days and is still applying entries from term 7. At T0 + 2 days, another election occurs in term 9. Now the commit point is in term 9. At T0 + 5 days, when the delayed node starts to apply entries in term 8, it cannot advance its commit point beyond its last applied. Eventually, when the node starts to apply entries from term 9, everything's fine again.
=======================================
Original title and description:
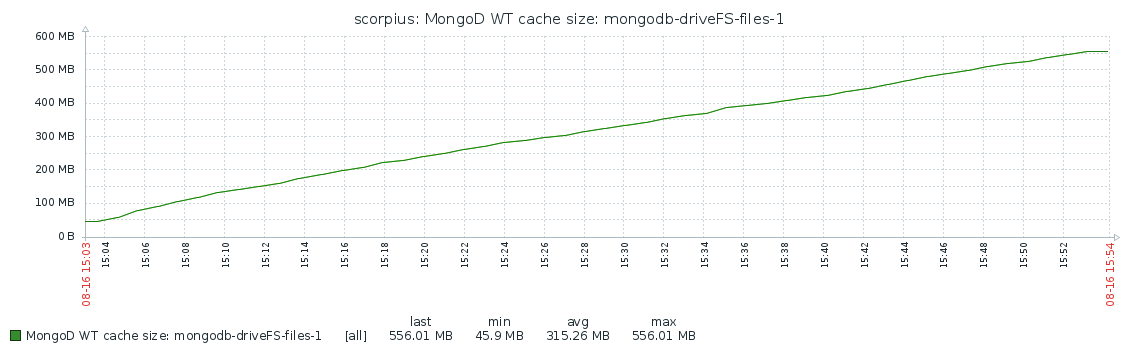
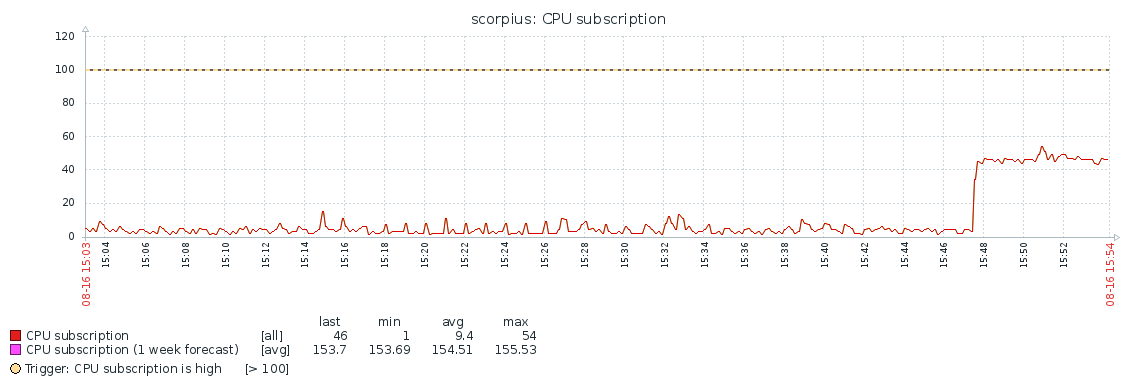
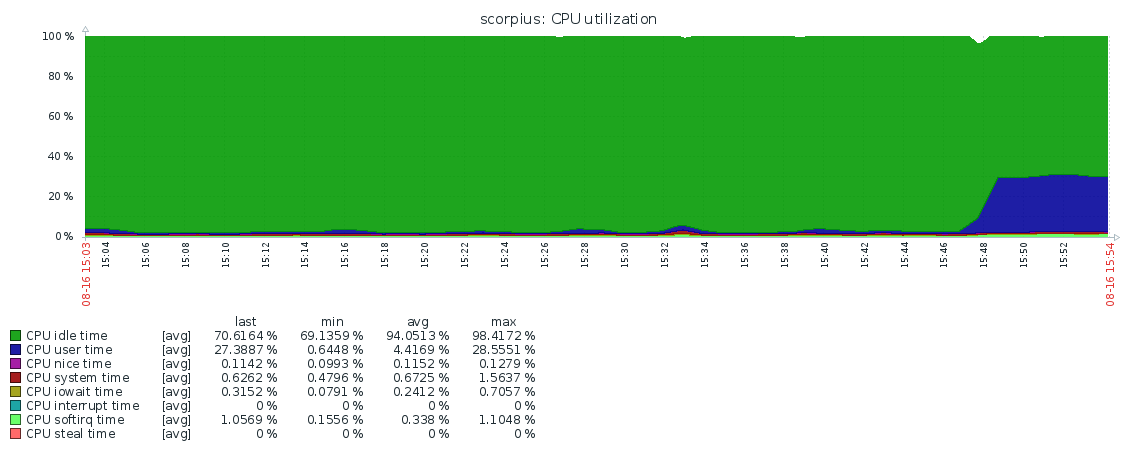
WT eviction threads consume a lot of CPU even when there is no apparent cache pressure
After upgrading from 3.6 to 4.0.12 we encountered an overly high CPU consumption on our slave-delayed hidden replica set member. Restarting the member doesn't help, the CPU consumption goes down, but then goes up after some time.
We recorded some logs, perf traces and statistics snapshots, see attached files. Also included are FTDC files for the relevant interval and some graphs from our monitoring system.
"Before" means before the CPU spike, "after" – after it (occured about 15:47:31 +/- 5s).
When CPU consumption is high, according to `perf report` about 96% of time is spent in `__wt_evict` (see `mongod-after.perf.txt` and `mongod-after.perf.data`). This coincides with `cache overflow score` metric jumping up from 0 to 100 (see `caches-before.log` and `caches-after.log`), despite the `bytes currently in the cache` (5703522791) being much smaller than `maximum bytes configured` (8589934592).
This is a hidden delayed secondary, so there should be next to no load except replicating writes which are pretty low-volume. Before upgrading to 4.0 we did not have any issues regarding this service.


- is related to
-
-
- Closed
-