Uploaded image for project: 'Core Server'
  1. Core Server
  2. SERVER-53853

Large buildup of mongos to mongod connections and low performance with secondaryPreferred reads

    • Type: Icon: Bug Bug
    • Resolution: Gone away
    • Priority: Icon: Major - P3 Major - P3
    • None
    • Affects Version/s: 4.2.0, 4.2.11
    • Component/s: None
    • Labels:
      None
    • ALL
    • Hide

      Run this workload against a single-shard cluster

      function repro() {
      
          nthreads = 500
          db.c.insert({_id: 0})
      
          threads = []
          for (var t=0; t<nthreads; t++) {
              thread = new Thread(function(t) {
                  while (true)
                      db.c.find({_id: 0}).readPref("secondaryPreferred").itcount()
              }, t)
              threads.push(thread)
              thread.start()
          }
          for (var t = 0; t < nthreads; t++)
              threads[t].join()
      
      }
      
      Show
      Run this workload against a single-shard cluster function repro() { nthreads = 500 db.c.insert({_id: 0}) threads = [] for (var t=0; t<nthreads; t++) { thread = new Thread(function(t) { while (true) db.c.find({_id: 0}).readPref("secondaryPreferred").itcount() }, t) threads.push(thread) thread.start() } for (var t = 0; t < nthreads; t++) threads[t].join() }
    • Service Arch 2021-02-08, Service Arch 2021-02-22, Service Arch 2021-03-08, Service Arch 2021-03-22, Service Arch 2021-04-05, Service Arch 2021-04-19, Service Arch 2021-05-03

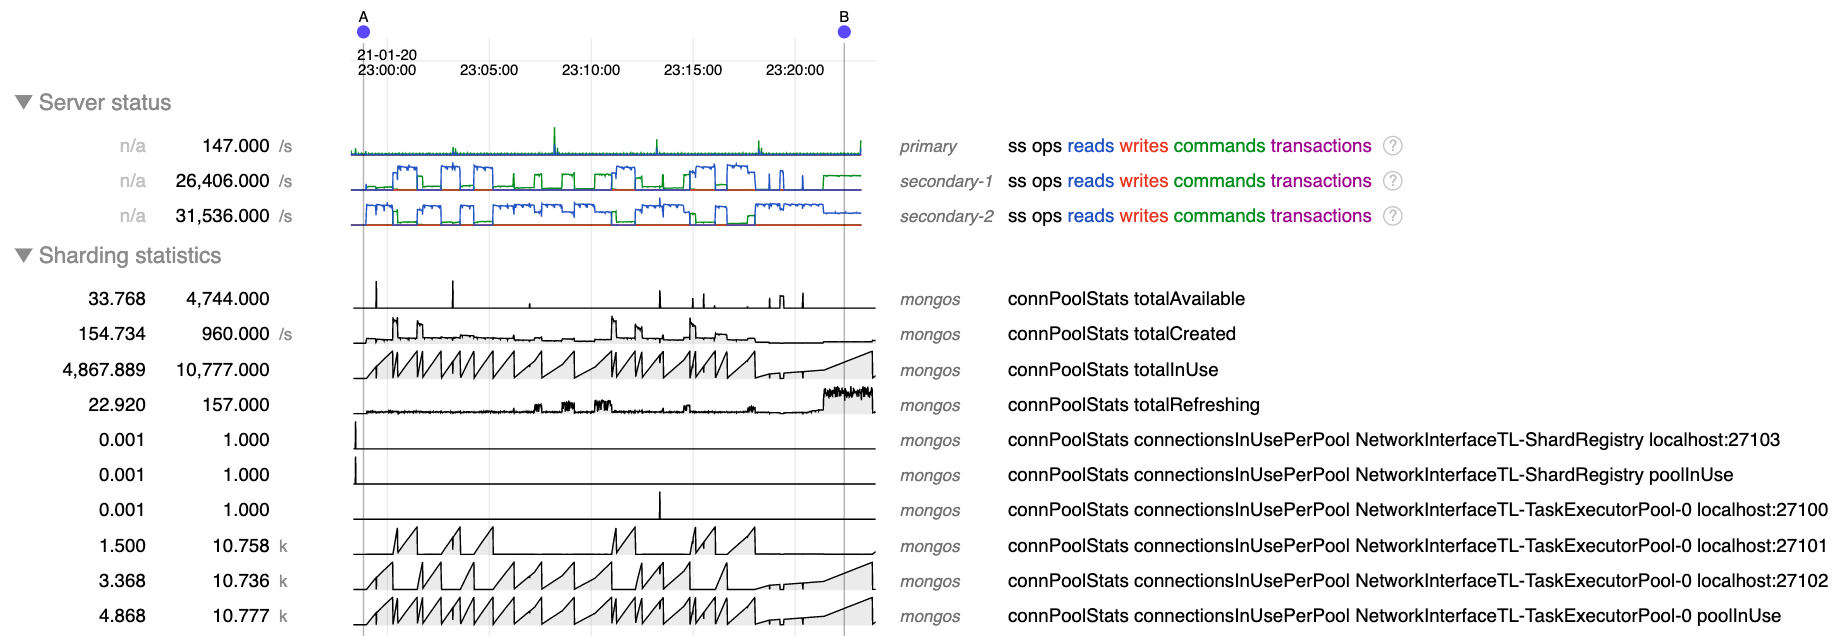
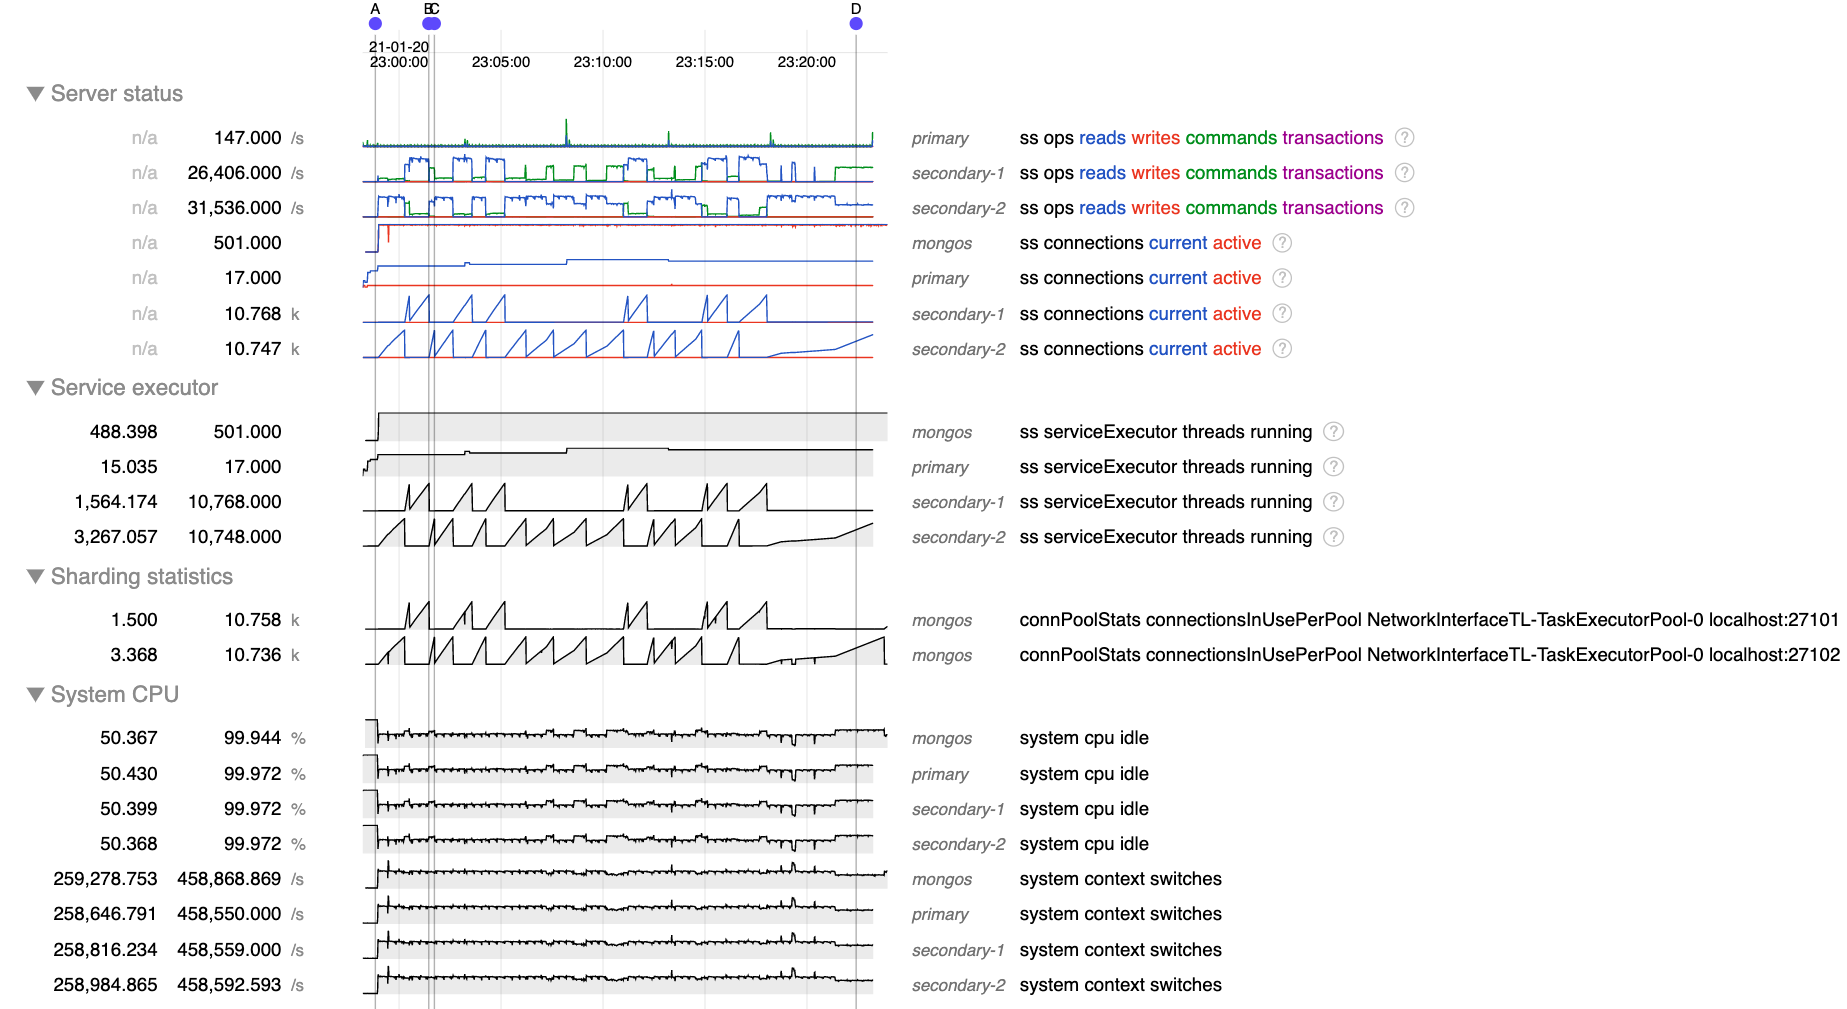
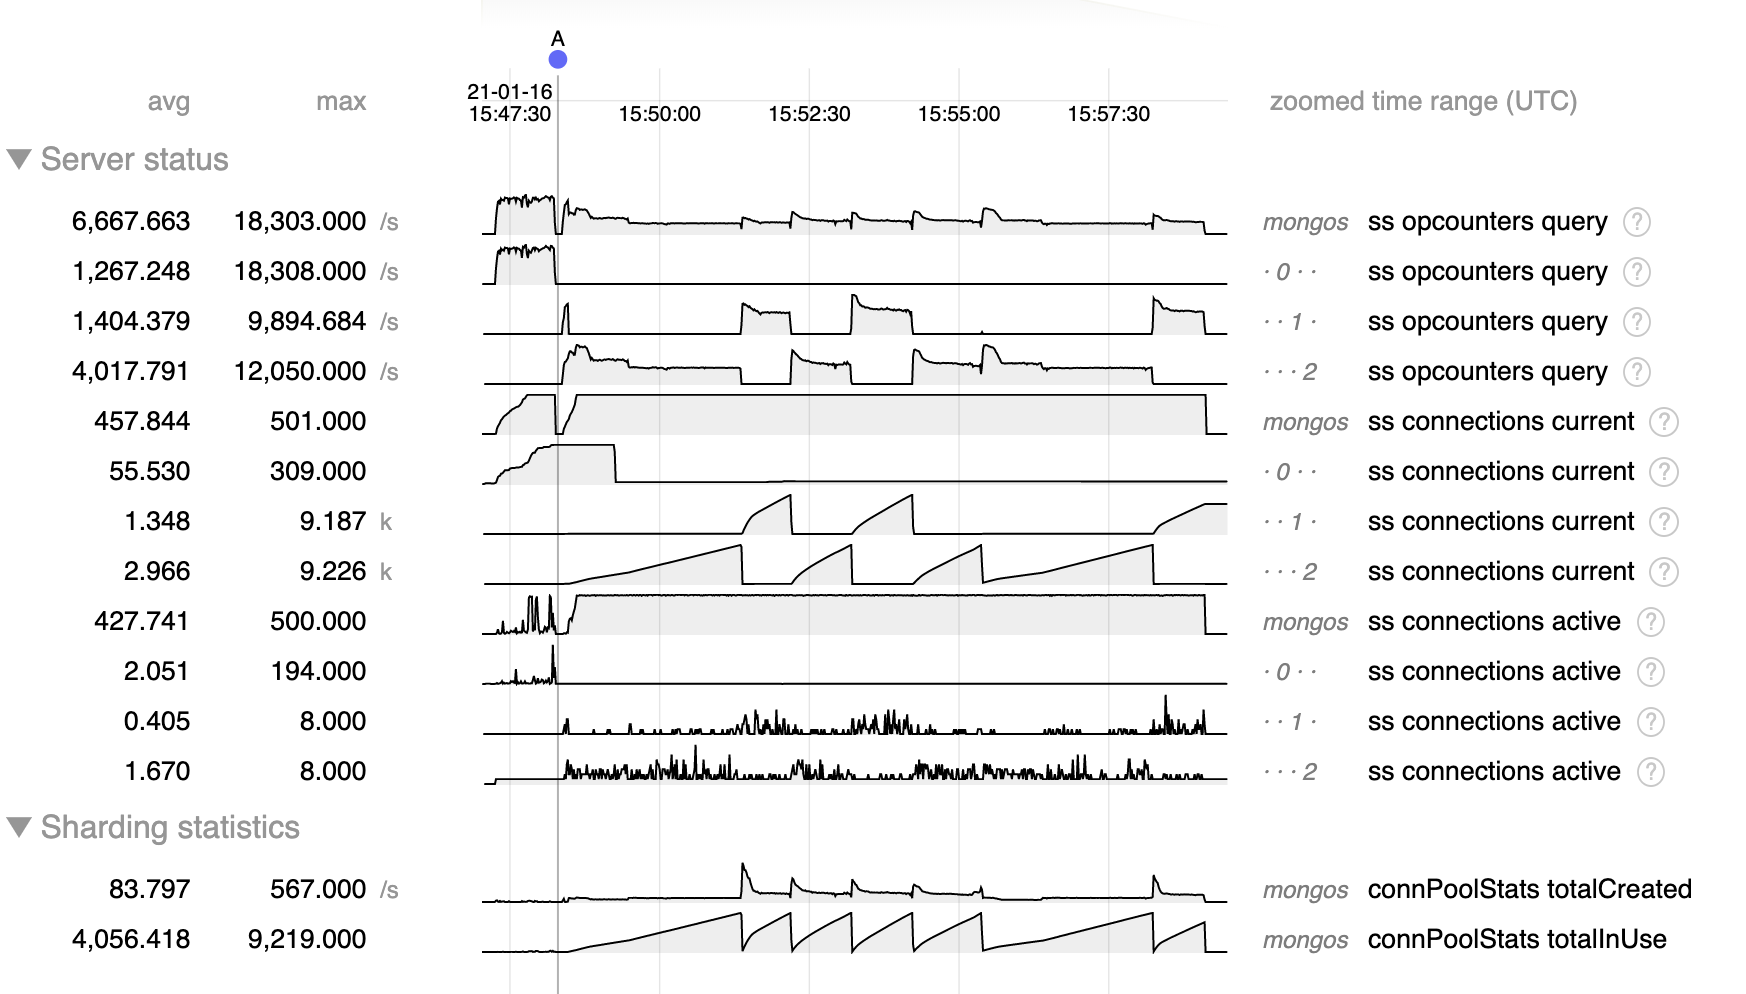
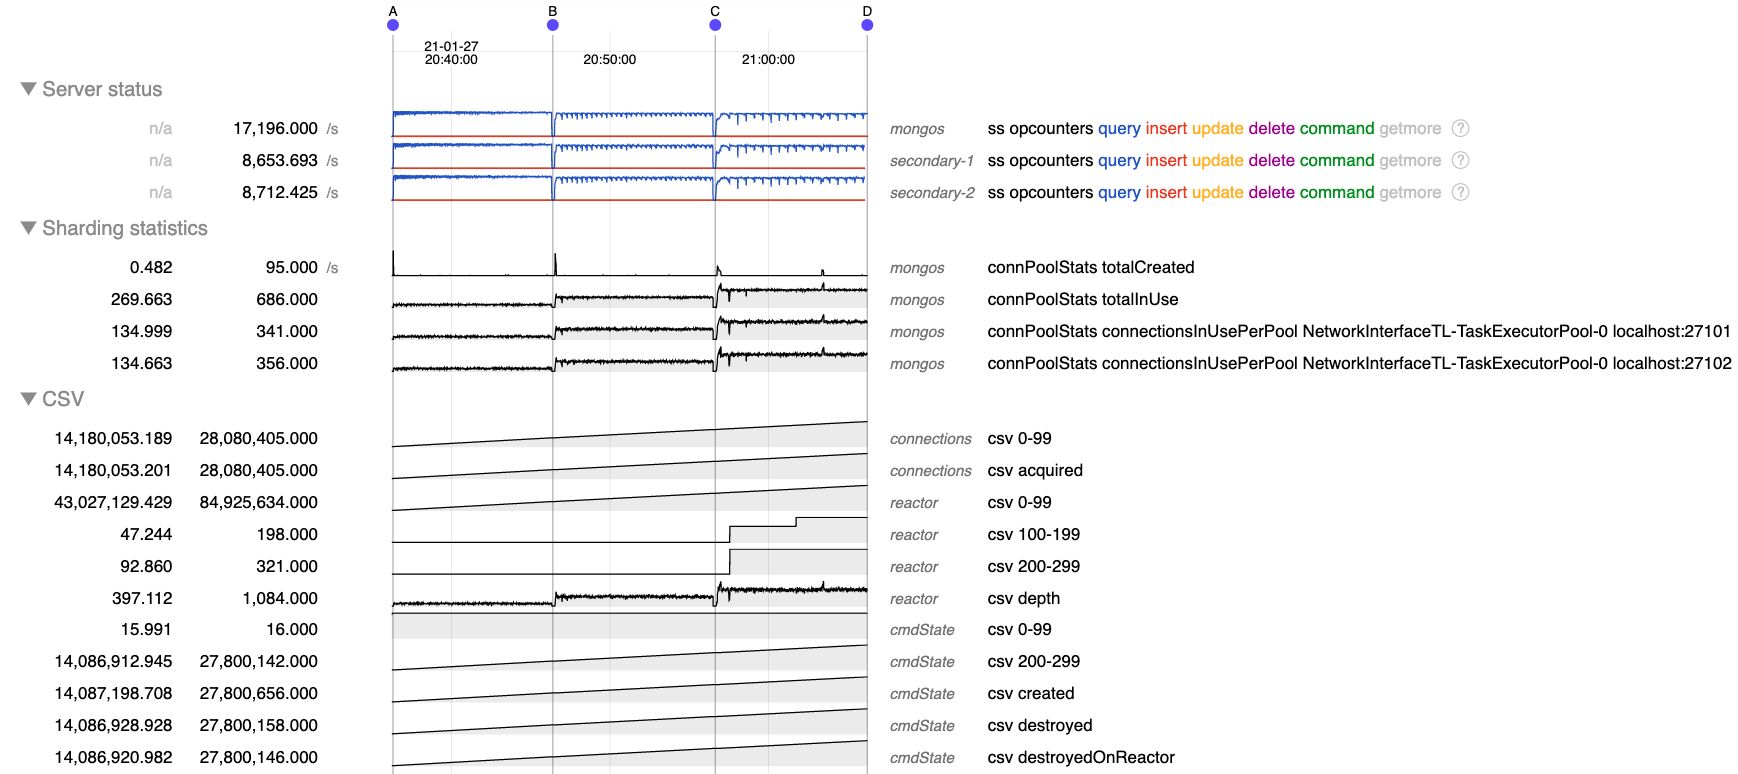
      Test consists of 500 threads doing secondaryPreferred reads as fast as possible against a single shard cluster. In the chart below the queries before A are from the primary for reference, after A are secondaryPreferred.

      • As expected, there are 500 connections to mongos, so there are as many as 500 outstanding operations.
      • Before A when reading from the primary (node 0) connections from mongos to mongod build to about 300, and the pool totalInUse and mongod active connections metrics are at times in the hundreds, justifying the need for 300 connections.
      • But after A when doing secondary reads connections from mongos to mongod build steadily up to about 10 k connections, far more than the 500 possible outstanding operations. Most of those are considered "in use" by mongos, but very few are "active" in mongod.
      • After reaching about 10 k connections the mongos seems to reset and begin building connections again, either to the same or a different secondary.
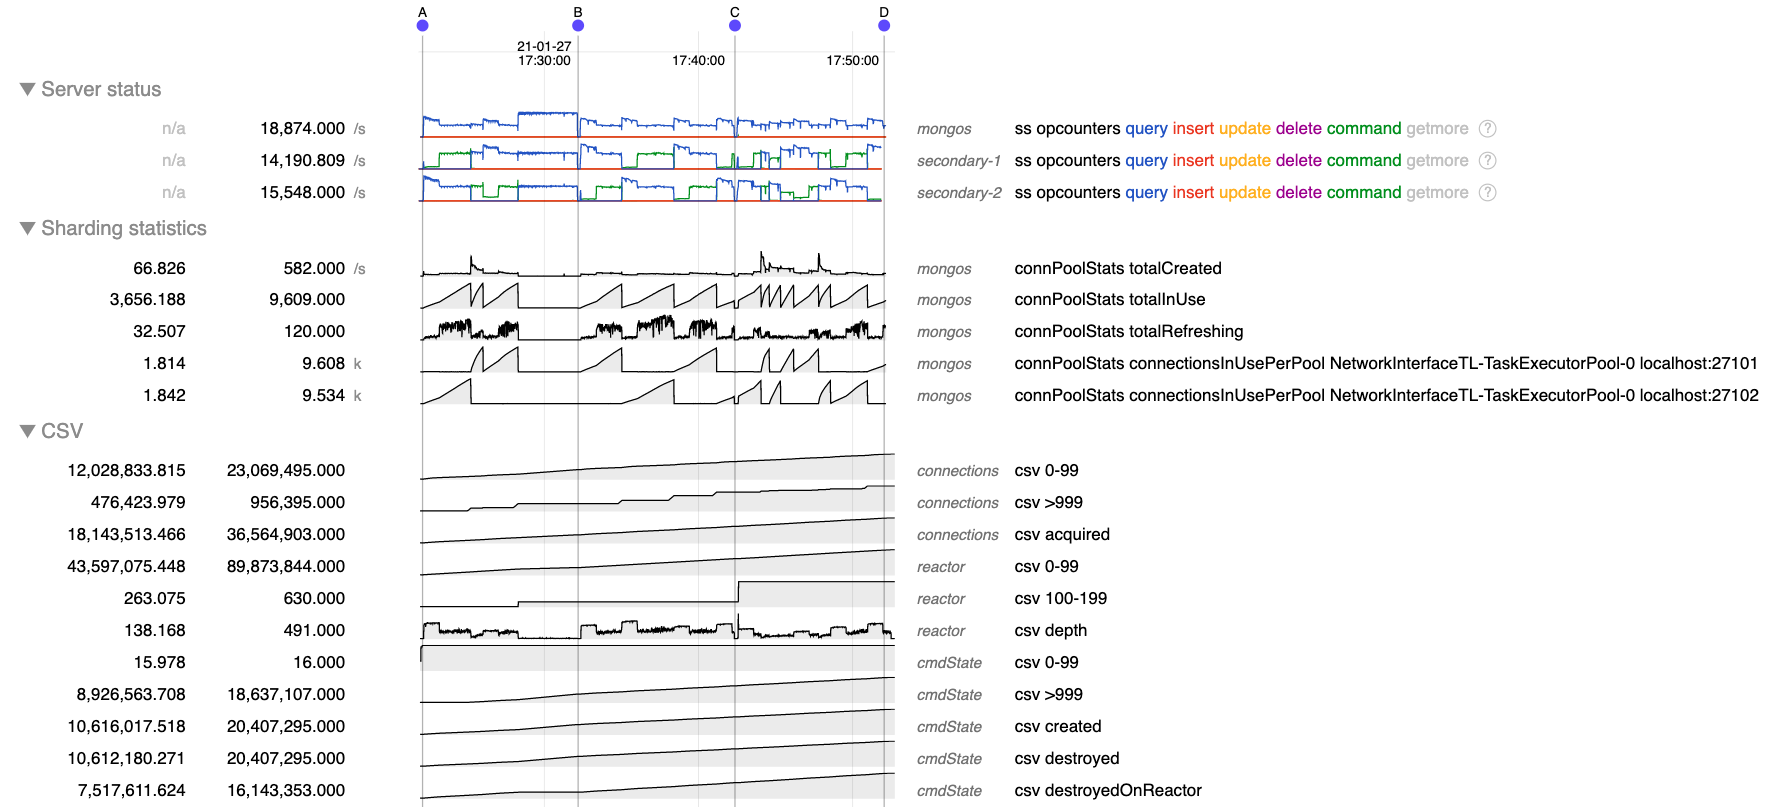
      • Slow query logs from mongos record a large number of operations taking tens of milliseconds, but almost non on mongod. The latency metrics from mongod confirm that there is no performance bottleneck on mongod.
      • Query throughput after A when doing secondary reads is much less than the primary reads before A. This seems to get worse as the number of connections build, but the latency on mongod remains low, so this is probably not due to an issue on mongod with the number of connections, but rather some issue in mongos.

        1. connection-pool.png
          connection-pool.png
          225 kB
        2. connections.png
          connections.png
          336 kB
        3. conns.png
          conns.png
          266 kB
        4. default-scheduling.png
          default-scheduling.png
          245 kB
        5. mongos-targeting.png
          mongos-targeting.png
          193 kB
        6. odd.png
          odd.png
          361 kB
        7. reactor-scheduling.png
          reactor-scheduling.png
          227 kB
        8. single-target-command.png
          single-target-command.png
          370 kB
        9. x-conns.tgz
          1.29 MB

            Assignee:
            amirsaman.memaripour@mongodb.com Amirsaman Memaripour
            Reporter:
            bruce.lucas@mongodb.com Bruce Lucas (Inactive)
            Votes:
            2 Vote for this issue
            Watchers:
            31 Start watching this issue

              Created:
              Updated:
              Resolved: