-
Type:
Bug
-
Resolution: Community Answered
-
Priority:
 Major - P3
-
None
-
Affects Version/s: 4.2.13
-
Component/s: None
-
ALL
-
None
-
None
-
None
-
None
-
None
-
None
-
None
We are running MongoDB in version 4.2.13. Replica set, primary and two replicas. Servers have 4 CPUs and 16gb of RAM (m5.xlarge on AWS) and are dedicated only to Mongo.
We are running Mongo with default config and transactionLifetimeLimitSeconds set to 900.
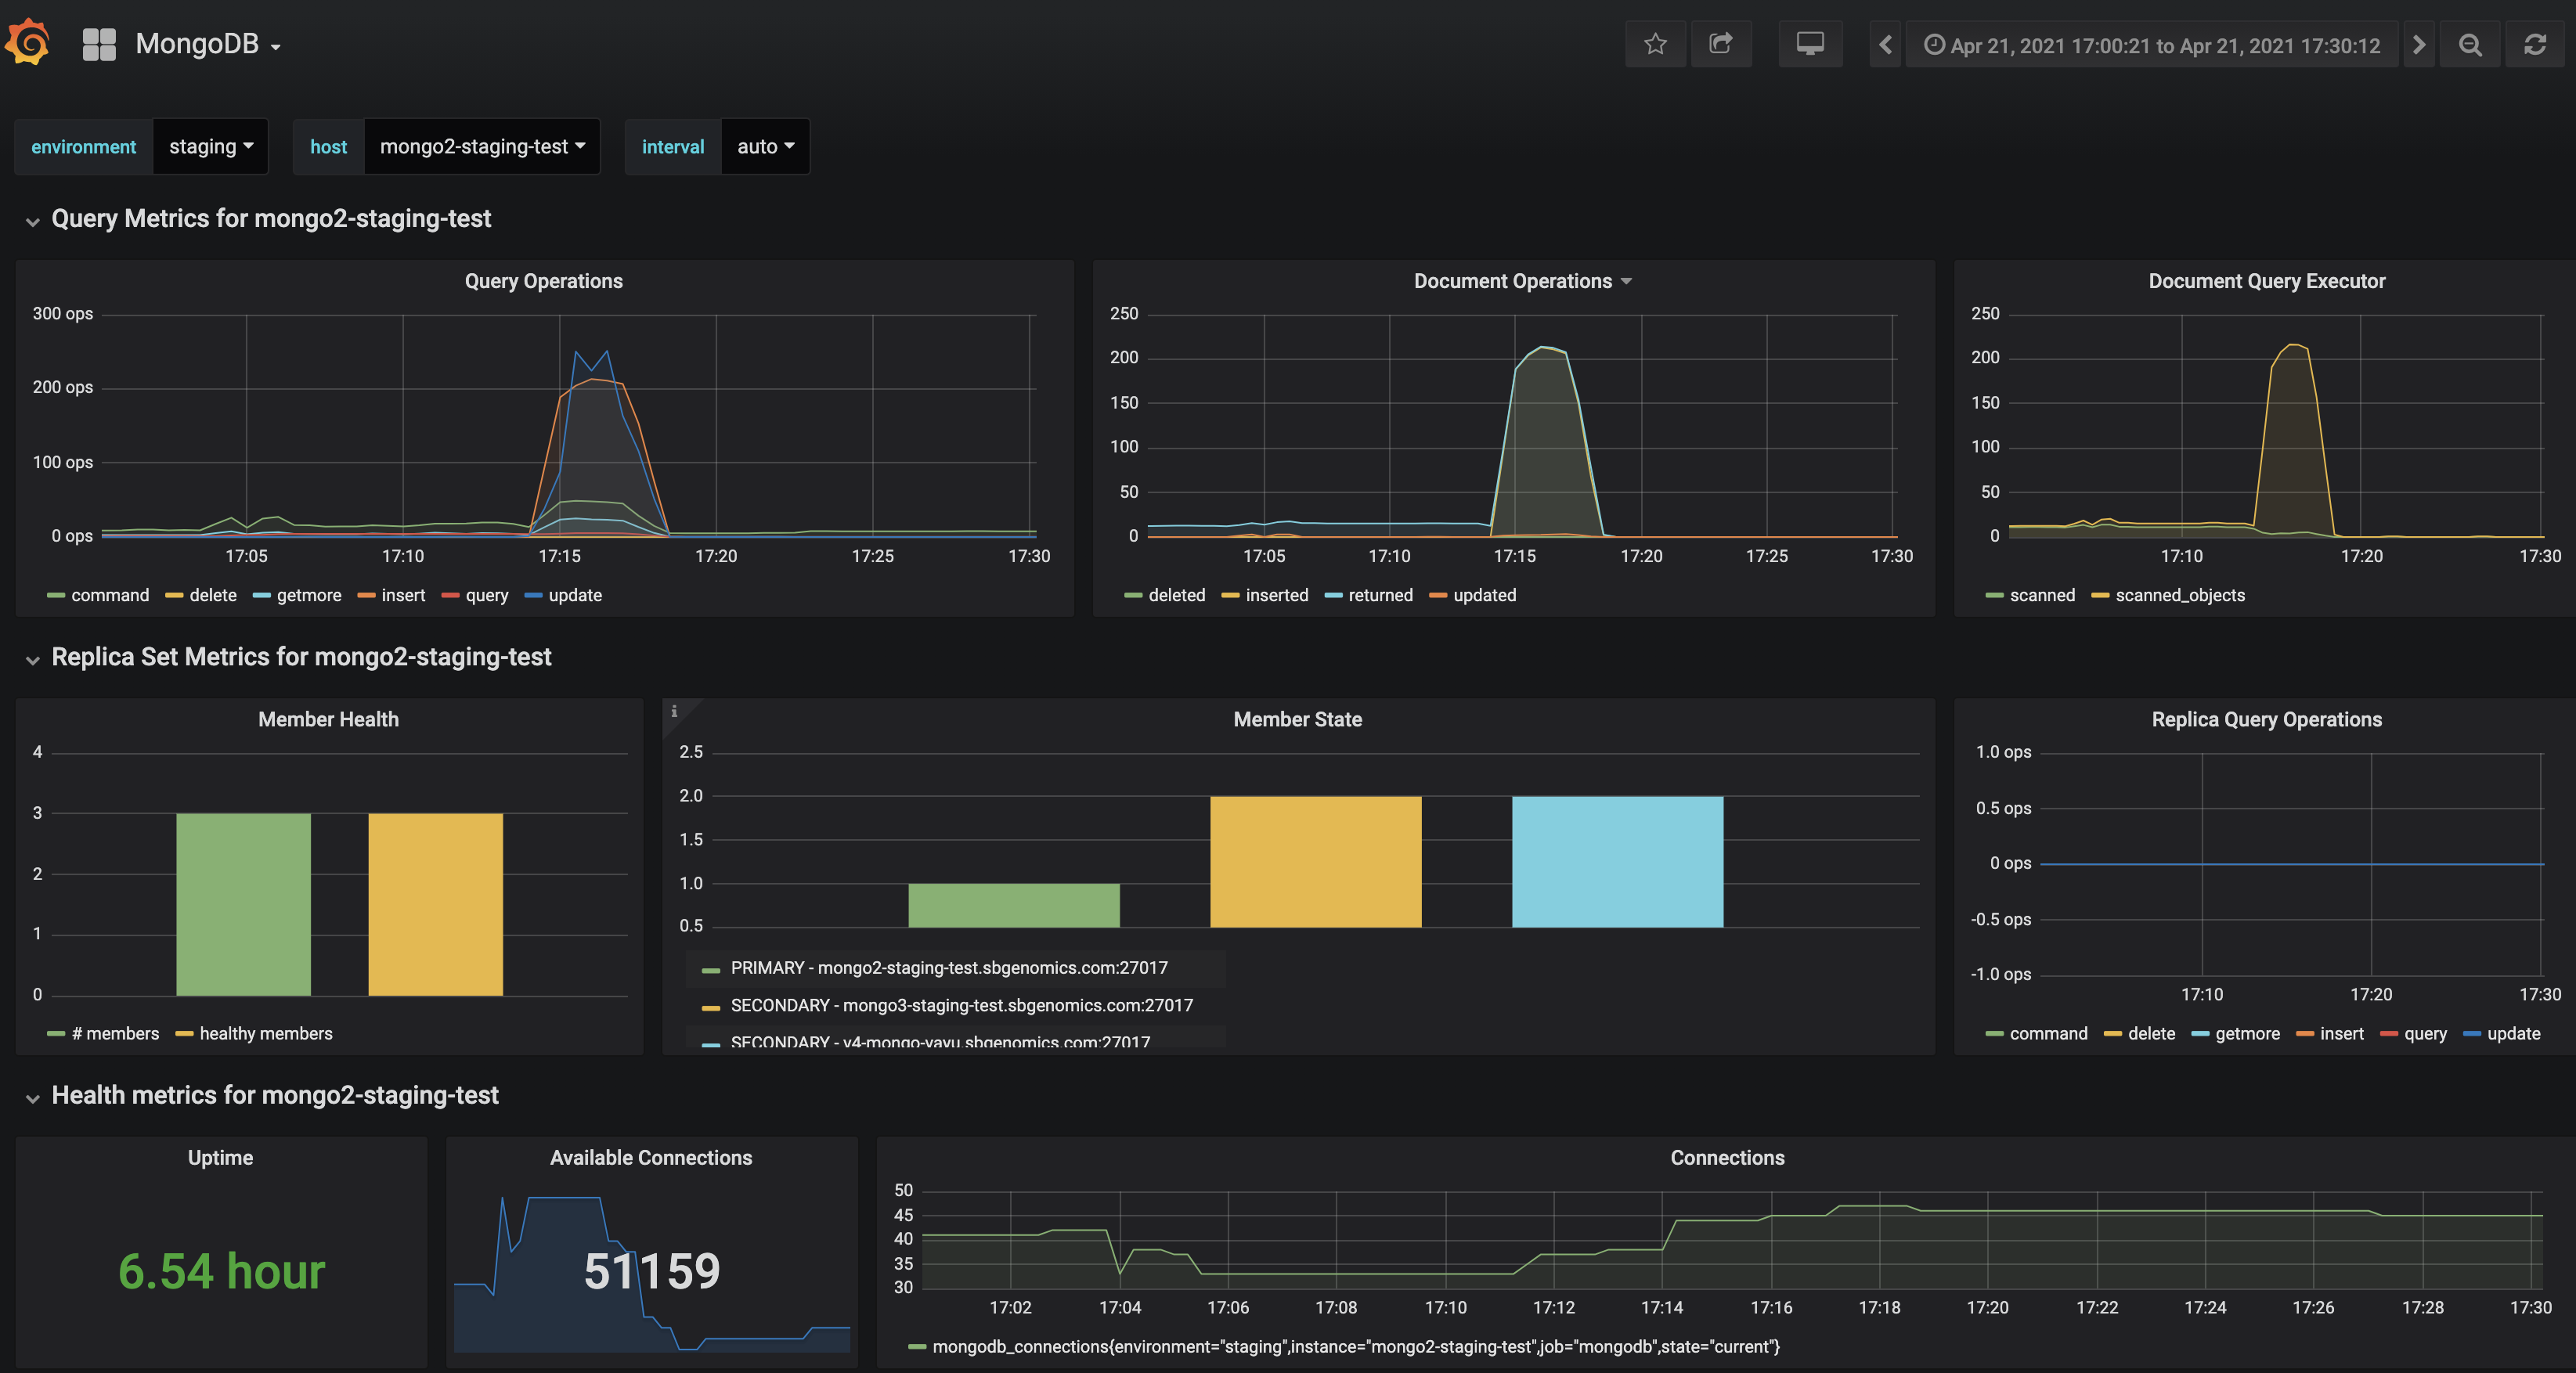
During the load tests, we are regularly encountering situations where the primary gets stuck. We are processing messages from mq with 10 threads and with those threads we are inserting results into Mongo.
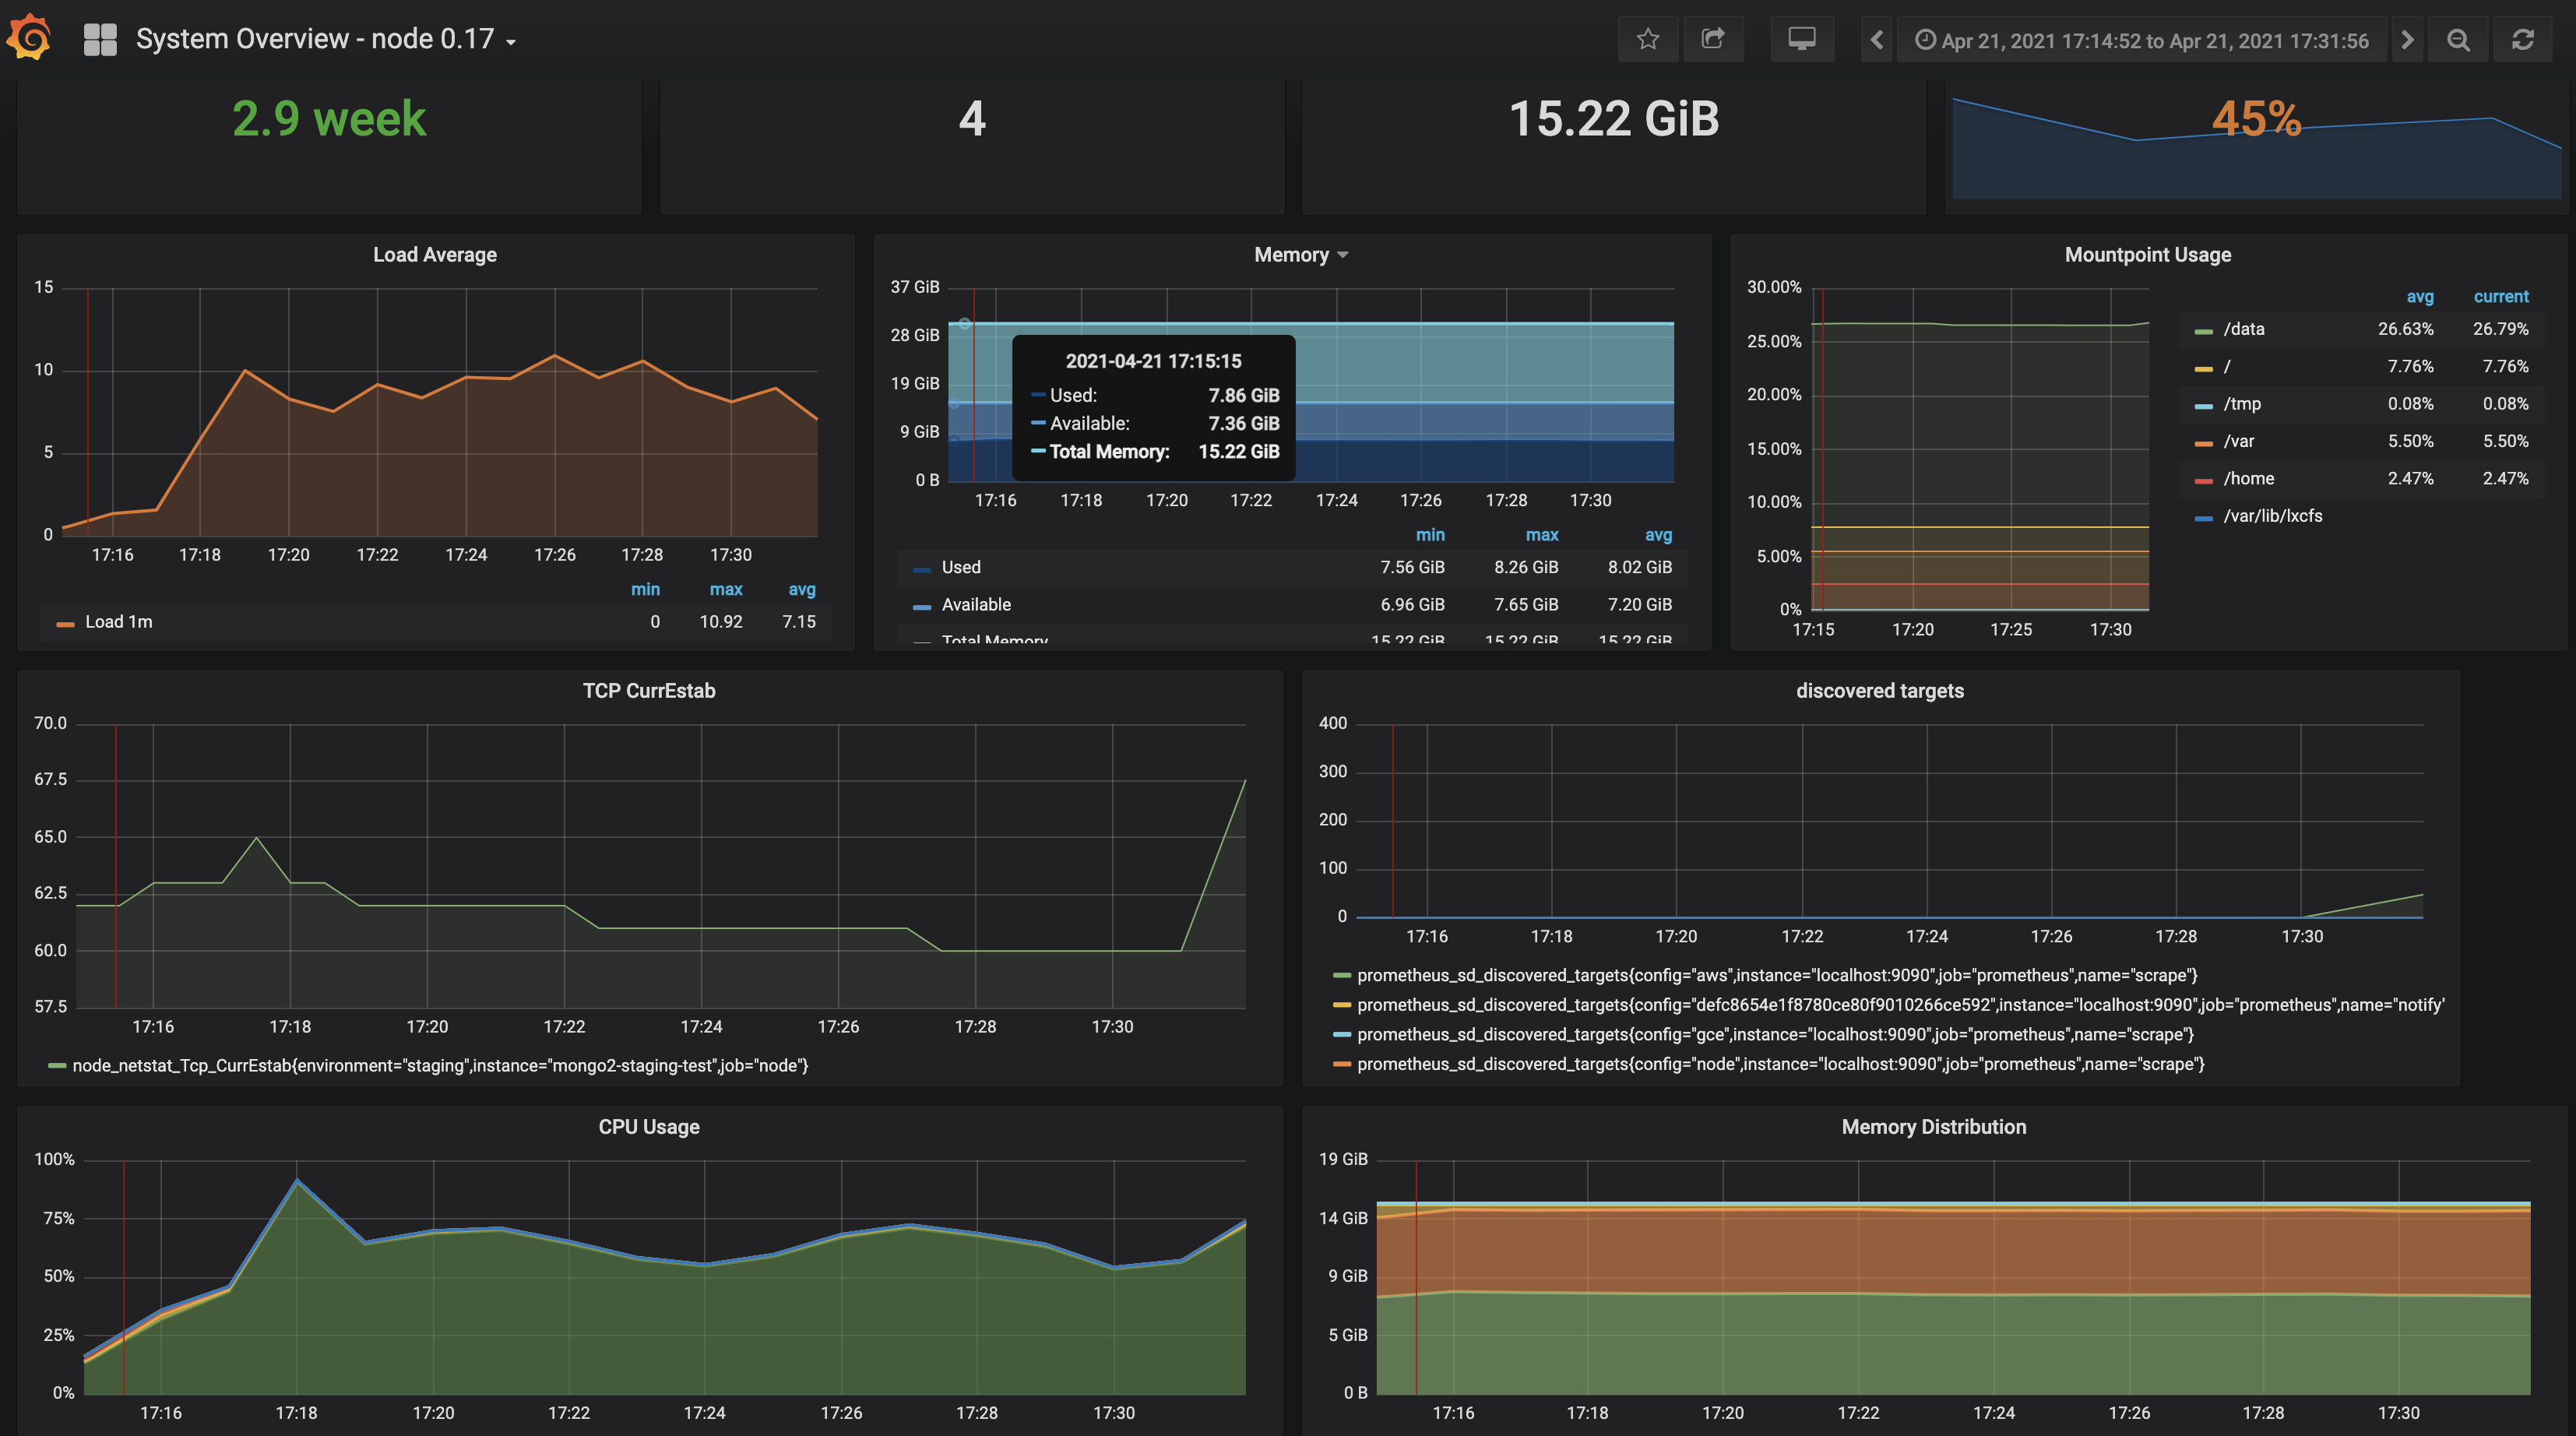
Load average becomes very high, around 9, and by watching mongotop and mongostat it seems Mongo isn’t performing any db operation at that time. iostat shows high values for user and idle params.
We couldn’t find any hint even with the profiler turned on. We have necessary indexes, meaning we are not seeing COLLSCAN in currentOp, which also didn't reveal to us anything obviously abnormal.
In attachment you can find:
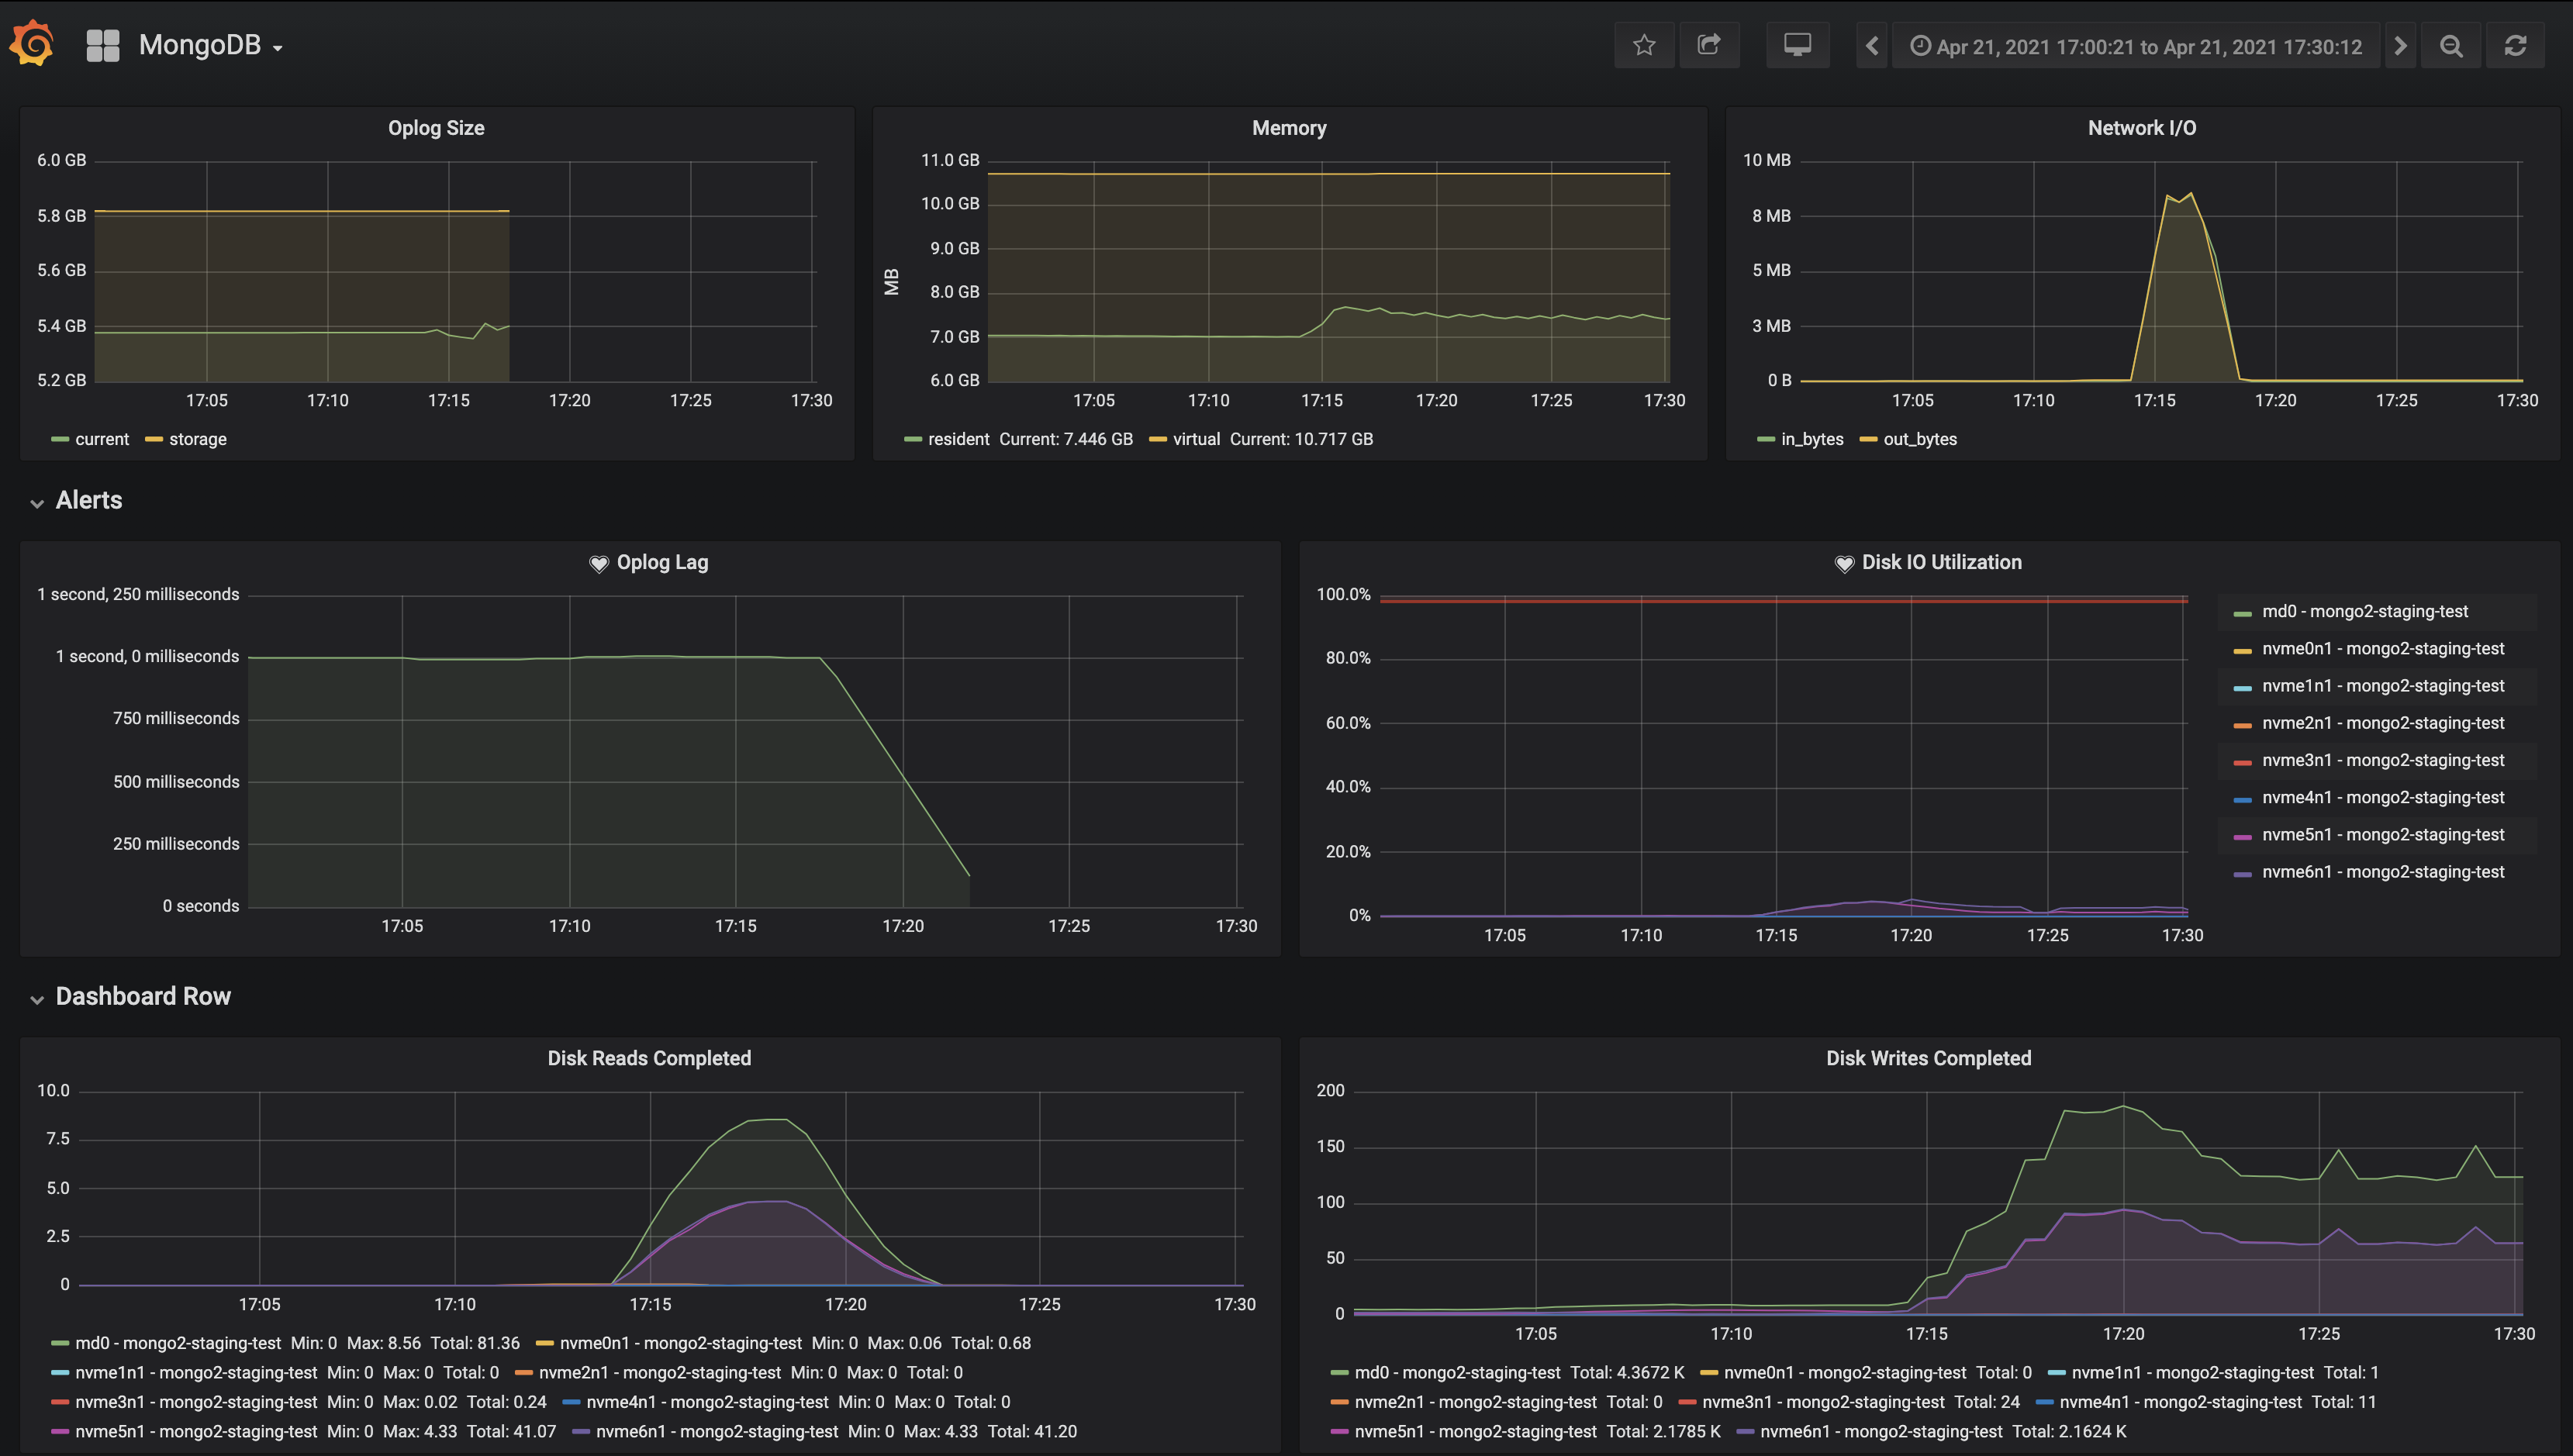
instance metrics, mongo metrics, mongostat and mongtop of problematic part (part where instance is under load but nothing shows under mongo),
serverStatus during the peak (high average load and high mongo load) and serverStatus after the peak (high average load and low mongo load). Stats for two of our main collections, jobHolder and jobRecord.
If necessary we can provide more info or perform additional tests and post results.
We are grateful for any advice on how to overcome this issue.