-
Type:
Improvement
-
Resolution: Duplicate
-
Priority:
 Major - P3
-
None
-
Affects Version/s: None
-
Component/s: None
-
None
-
Server Security
-
None
-
None
-
None
-
None
-
None
-
None
-
None
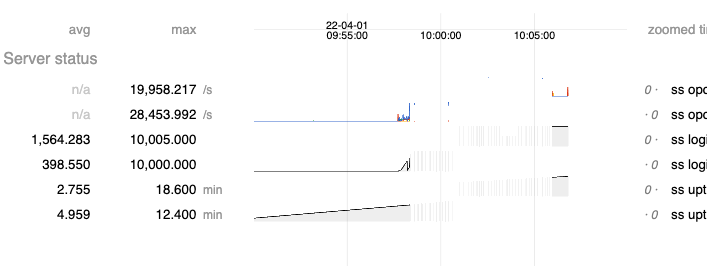
While working on SERVER-64503 we discovered that we can't really see what's going on in the server during extreme cases of contention. Which would prove to be greatly valuable information in order to debug what the issues are.

During the test run we saw multiple entries in the mongod log that seem to point to the ftdc thread performing really poorly. We've attempted to set its thread scheduling priority to use SCHED_FIFO and the priority to the max value but that didn't seem to fix the issue.
| 2022-04-01T10:00:43.832+00:00 I  COMMAND  20499   [ftdc] "serverStatus was very slow","attr":{"timeStats":{"after basic":0,"after activeIndexBuilds":0,"after asserts":0,"after bucketCatalog":0,"after catalogStats":0,"after connections":0,"after electionMetrics":0,"after extra_info":2,"after flowControl":2,"after freeMonitoring":2,"after globalLock":5,"after locks":3303,"after logicalSessionRecordCache":3303,"after mirroredReads":3303,"after network":3303,"after opLatencies":3303,"after opcounters":3303,"after opcountersRepl":3303,"after oplogTruncation":3303,"after readConcernCounters":3303,"after repl":3303,"after scramCache":3303,"after security":3303,"after storageEngine":3303,"after tcmalloc":3307,"after tenantMigrations":3307,"after trafficRecording":3307,"after transactions":3307,"after transportSecurity":3307,"after twoPhaseCommitCoordinator":3307,"after wiredTiger":3307,"at end":7832}}
...
| 2022-04-01T10:04:06.873+00:00 I  COMMAND  20499   [ftdc] "serverStatus was very slow","attr":{"timeStats":{"after basic":0,"after activeIndexBuilds":0,"after asserts":0,"after bucketCatalog":0,"after catalogStats":0,"after connections":0,"after electionMetrics":0,"after extra_info":2,"after flowControl":2,"after freeMonitoring":2,"after globalLock":25,"after locks":25,"after logicalSessionRecordCache":25,"after mirroredReads":25,"after network":25,"after opLatencies":25,"after opcounters":25,"after opcountersRepl":25,"after oplogTruncation":25,"after readConcernCounters":25,"after repl":25,"after scramCache":25,"after security":25,"after storageEngine":25,"after tcmalloc":30,"after tenantMigrations":30,"after trafficRecording":30,"after transactions":30,"after transportSecurity":30,"after twoPhaseCommitCoordinator":30,"after wiredTiger":5303,"at end":8375}}
...
| 2022-04-01T10:04:26.719+00:00 I  COMMAND  20499   [ftdc] "serverStatus was very slow","attr":{"timeStats":{"after basic":0,"after activeIndexBuilds":0,"after asserts":0,"after bucketCatalog":0,"after catalogStats":0,"after connections":0,"after electionMetrics":0,"after extra_info":2,"after flowControl":2,"after freeMonitoring":2,"after globalLock":4,"after locks":4,"after logicalSessionRecordCache":4,"after mirroredReads":4,"after network":4,"after opLatencies":6,"after opcounters":6,"after opcountersRepl":6,"after oplogTruncation":6,"after readConcernCounters":6,"after repl":6,"after scramCache":6,"after security":6,"after storageEngine":6,"after tcmalloc":4376,"after tenantMigrations":4376,"after trafficRecording":4376,"after transactions":4376,"after transportSecurity":4376,"after twoPhaseCommitCoordinator":4376,"after wiredTiger":4377,"at end":8792}}
...
| 2022-04-01T10:04:50.684+00:00 I  COMMAND  20499   [ftdc] "serverStatus was very slow","attr":{"timeStats":{"after basic":0,"after activeIndexBuilds":0,"after asserts":0,"after bucketCatalog":0,"after catalogStats":0,"after connections":0,"after electionMetrics":0,"after extra_info":2,"after flowControl":2,"after freeMonitoring":2,"after globalLock":12,"after locks":12,"after logicalSessionRecordCache":12,"after mirroredReads":12,"after network":12,"after opLatencies":12,"after opcounters":12,"after opcountersRepl":12,"after oplogTruncation":12,"after readConcernCounters":12,"after repl":4881,"after scramCache":4881,"after security":4881,"after storageEngine":4881,"after tcmalloc":7479,"after tenantMigrations":7479,"after trafficRecording":7479,"after transactions":7479,"after transportSecurity":7479,"after twoPhaseCommitCoordinator":7479,"after wiredTiger":7480,"at end":7484}}
...
| 2022-04-01T10:07:31.799+00:00 I  COMMAND  20499   [ftdc] "serverStatus was very slow","attr":{"timeStats":{"after basic":0,"after activeIndexBuilds":0,"after asserts":0,"after bucketCatalog":0,"after catalogStats":0,"after connections":0,"after electionMetrics":0,"after extra_info":2,"after flowControl":2,"after freeMonitoring":2,"after globalLock":15,"after locks":15,"after logicalSessionRecordCache":913,"after mirroredReads":913,"after network":913,"after opLatencies":913,"after opcounters":913,"after opcountersRepl":913,"after oplogTruncation":913,"after readConcernCounters":913,"after repl":913,"after scramCache":913,"after security":913,"after storageEngine":913,"after tcmalloc":920,"after tenantMigrations":920,"after trafficRecording":920,"after transactions":920,"after transportSecurity":920,"after twoPhaseCommitCoordinator":920,"after wiredTiger":920,"at end":7799}}
...
| 2022-04-01T10:08:10.551+00:00 I  COMMAND  20499   [ftdc] "serverStatus was very slow","attr":{"timeStats":{"after basic":0,"after activeIndexBuilds":0,"after asserts":0,"after bucketCatalog":0,"after catalogStats":0,"after connections":0,"after electionMetrics":0,"after extra_info":3,"after flowControl":3,"after freeMonitoring":3,"after globalLock":6,"after locks":6,"after logicalSessionRecordCache":6,"after mirroredReads":6,"after network":6,"after opLatencies":6,"after opcounters":6,"after opcountersRepl":6,"after oplogTruncation":2456,"after readConcernCounters":2456,"after repl":2456,"after scramCache":2456,"after security":2456,"after storageEngine":2456,"after tcmalloc":2462,"after tenantMigrations":2462,"after trafficRecording":2462,"after transactions":2462,"after transportSecurity":2462,"after twoPhaseCommitCoordinator":2462,"after wiredTiger":7666,"at end":10408}}
...
| 2022-04-01T10:09:36.029+00:00 I  COMMAND  20499   [ftdc] "serverStatus was very slow","attr":{"timeStats":{"after basic":0,"after activeIndexBuilds":0,"after asserts":0,"after bucketCatalog":0,"after catalogStats":0,"after connections":0,"after electionMetrics":0,"after extra_info":2,"after flowControl":2,"after freeMonitoring":2,"after globalLock":334,"after locks":334,"after logicalSessionRecordCache":7857,"after mirroredReads":7857,"after network":7857,"after opLatencies":7857,"after opcounters":7857,"after opcountersRepl":7857,"after oplogTruncation":7857,"after readConcernCounters":7857,"after repl":7857,"after scramCache":7857,"after security":7857,"after storageEngine":7857,"after tcmalloc":8195,"after tenantMigrations":8195,"after trafficRecording":8195,"after transactions":8195,"after transportSecurity":8195,"after twoPhaseCommitCoordinator":8195,"after wiredTiger":8196,"at end":11029}}
Note that the numbers are milliseconds. The log seems to indicate that the following points in the serverStatus command are bottlenecks and could do with some performance improvements:
- logicalSessionRecordCache
- locks
- tcmalloc
- repl
- oplogTruncation
- wiredTiger
- at end
Additionally, after performing some preliminary searches it seems that the Linux system metrics collector is also a bottleneck at points due to the multiple syscalls needed to get the necessary information from the /proc filesystem.
Attached to the ticket is a flamegraph of a perf recording of the ftdc thread during the benchmark run. The read() syscall can be seen as taking a relatively decent chunk of the processing time.
- related to
-
SERVER-76723 Create FTDC stall monitor
-
- Open
-