-
Type:
Bug
-
Resolution: Done
-
Priority:
 Critical - P2
-
None
-
Affects Version/s: 2.0.7, 2.2.1
-
Component/s: Replication
-
Environment:Linux x86-64 (Ubuntu 12.04.1)
-
ALL
-
None
-
None
-
None
-
None
-
None
-
None
-
None
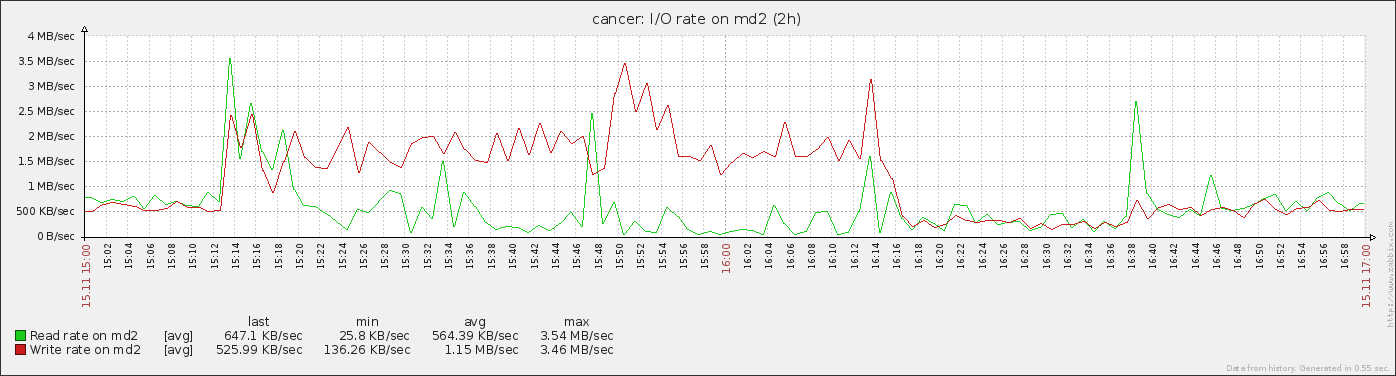
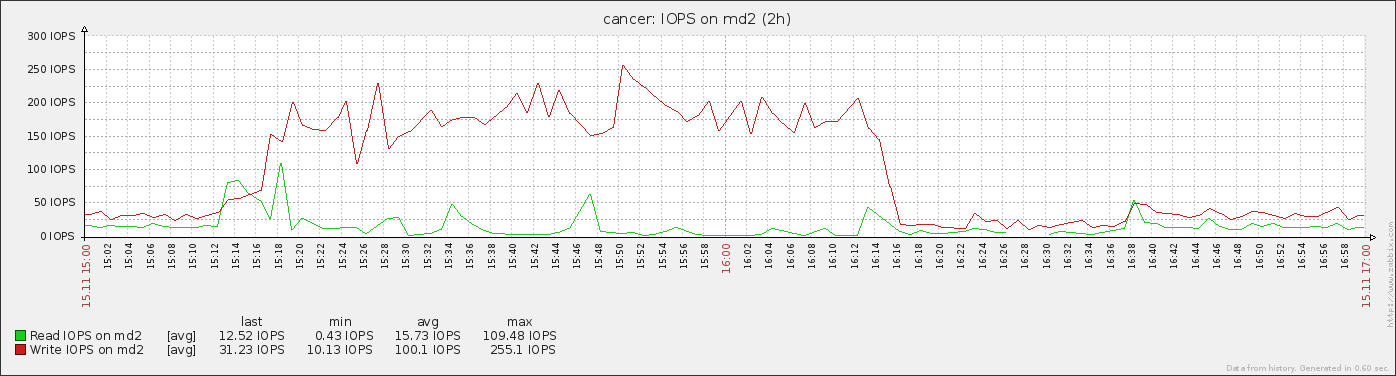
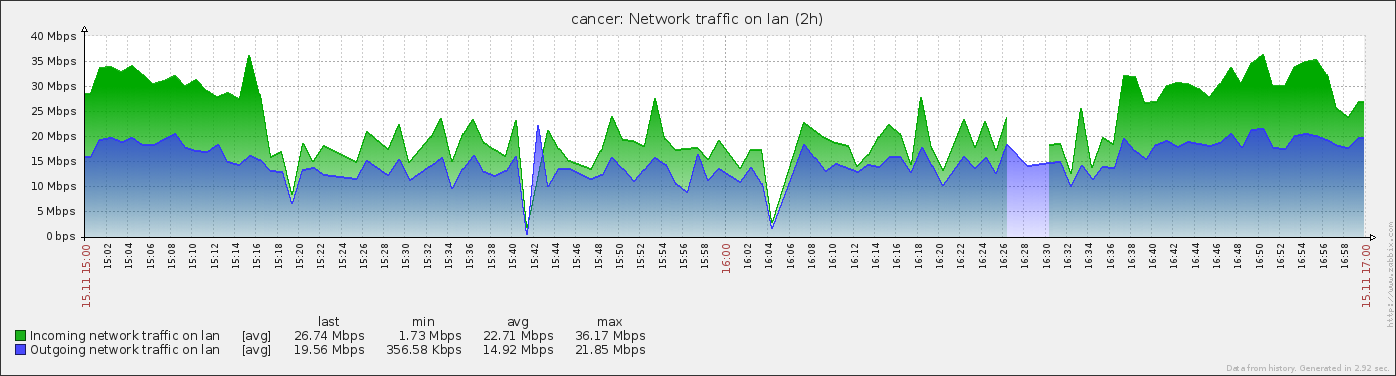
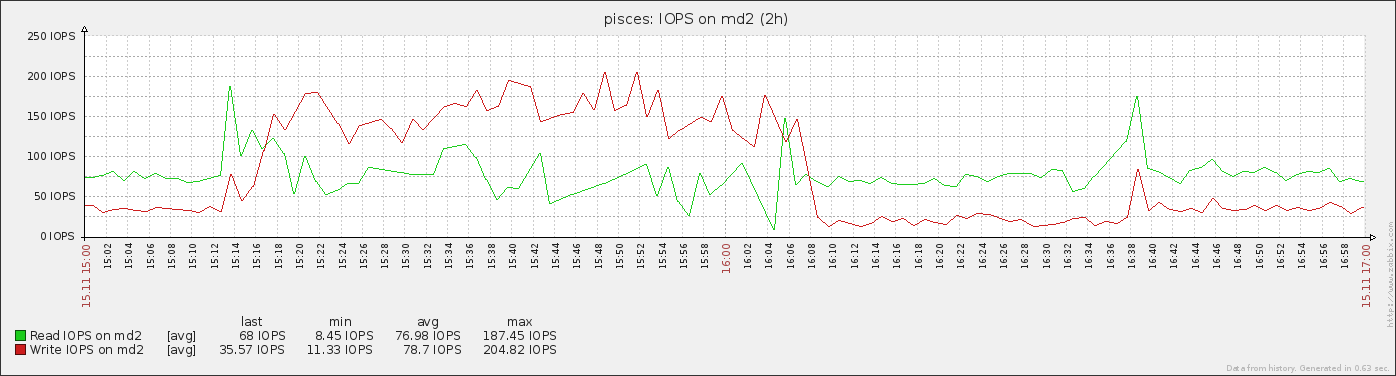
Recently, we had some issues with replica set failover, due to server not being able to cope with the high I/O load caused by spiky migrations (see SERVER-7686 for a more detailed description of the original problem) – mongod intermittently stops responding to network connections because it's busy doing I/O, so other RS members believe it's dead.
While this problem by itself is bad enough, the failover result we got was, well, very bad – let me describe it in detail.
The cluster in question hosts a MongoDB database containing GridFS data, which currently has about 30 million files occupying 1.5TiB of data. It has two mongos routers (b1, b2), three config servers (c1, c2, c3) and four shards that are each comprised of two data servers (d1.sN, d2.sN) and an arbiter (a.sN), where N is the shard number (1-4).
Writes to the database are done via mongos routers (using C# driver, but that is irrelevant since we already ruled out that problem), with SafeMode.true, but without the w:majority (yes, we know that w:majority is required for consistent failover, but we were not yet able to implement it).
When the problem hit us, I first thought that everything went more or less okay – after I've got a notification from our Zabbix monitoring, I went and checked the "rollback" folders on all servers and found out that there were none. Then I checked the logs and saw that there were repeated "failures" in quick succession, so I thought that client code wasn't able to pick up new master, hence the absence of the rollback. A few days later I was checking the other server (the one which only reads from the database) logs and found out that some files could not be readfrom GridFS. Surprisingly, the fs.file document was intact, but there were no associated documents in the fs.chunks collection. Then, I did a quick check for the amount of files and chunks, expecting count of GridFS chunks to be a bit larger than amount of files and to my own horror discovered, that we're missing at least 500000 GridFS for non-zero-length files.
From this on I had three primary suspects:
1. database corruption due to external reasons
2. mongos chunk migration gone awry (either failed migration mistakenly recorded as successful or inconsistent shard min/max values in chunk map)
3. ?
I quickly ruled out #3, because there were no power failures, disks are fine (checked SMART attributes, did a patrol read and a selftest), syslog/dmesg are clean, etc.
Then, I checked chunk migration. While it was the original cause of disk overload, the missing files were not in ranges of chunks that were transferred (checked the primary logs along with config.changelog collection of the config database).
Then, I decided to rule out user error, so I checked the oplog for the related file (since I knew the fs.files id (NumberLong("1113206594855763968")), I executed the following for all shard replica sets (directly connected to "local" databases, not via mongos):
db.oplog.rs.find({"o.files_id":NumberLong("1113206594855763968")}).sort({$natural:-1}).limit(1)<code>
which found exactly one "insert" operation on exactly one replica set:
{ "ts" : Timestamp(1352980035000, 28), "h" : NumberLong("2879588865588641652"), "v" : 2, "op" : "i", "ns" : "a.fs.chunks", "o" : { "_id" : ObjectId("50a4d6366b8dda1458505dbb"), "files_id" : NumberLong("1113206594855763968"), "n" : 0, "data" : BinData(0,"...")
After this, I knew the _id for the fs.chunks document, so I checked if it was deleted, partially to ensure it's not chunk migration, partially to completely rule out errors in client code (which was working fine) with:
db.oplog.rs.find({"o._id":ObjectId("50a4d6366b8dda1458505dbb")}).sort({$natural:-1}).limit(1)
Too bad it returned the same "insert" operation, so as far as I know how oplog is structured, the document was inserted and never deleted (which completely rules out migration failure, since I checked each RS directly), yet is not present in the database.
Reading logs was my next step. Arbiter didn't have anything interesting aside from the fact that servers were going "up" and "down" (I would like to reminde the reader that mongod processes were running fine, just were blocked with I/O so much that they could not accept connections in a timely fashion). Primary had almost the same logs with addition of migration-related info (moveChunk started, committing, etc.).
Thu Nov 15 15:26:53 [rsHealthPoll] DBClientCursor::init call() failed
Thu Nov 15 15:26:53 [rsHealthPoll] replSet info d1.s1.fs.drive.bru:27021 is down (or slow to respond): DBClientBase::findN: transpor
Thu Nov 15 15:26:53 [rsHealthPoll] replSet member d1.s1.fs.drive.bru:27021 is now in state DOWN
Thu Nov 15 15:26:53 [rsMgr] not electing self, we are not freshest
Thu Nov 15 15:26:59 [rsMgr] not electing self, we are not freshest
Thu Nov 15 15:27:05 [rsHealthPoll] DBClientCursor::init call() failed
Thu Nov 15 15:27:05 [rsMgr] replSet info electSelf 1
Thu Nov 15 15:27:17 [rsHealthPoll] DBClientCursor::init call() failed
Thu Nov 15 15:27:25 [rsMgr] replSet PRIMARY
Thu Nov 15 15:27:26 [rsBackgroundSync] replset 1134533 ops were not applied from buffer, this should cause a rollback on the former
Thu Nov 15 15:27:27 [rsHealthPoll] replSet member d1.s1.fs.drive.bru:27021 is up
Thu Nov 15 15:27:27 [rsHealthPoll] replSet member d1.s1.fs.drive.bru:27021 is now in state PRIMARY
Thu Nov 15 15:27:27 [rsMgr] replSet relinquishing primary state
Thu Nov 15 15:27:27 [rsMgr] replSet SECONDARY
Thu Nov 15 15:27:27 [rsMgr] replSet closing client sockets after relinquishing primary
Thu Nov 15 15:27:28 [rsBackgroundSync] replSet syncing to: d1.s1.fs.drive.bru:27021
Thu Nov 15 15:27:28 [rsHealthPoll] replSet info a.s1.fs.drive.bru:27021 is down (or slow to respond): socket exception [SEND_ERROR]
Thu Nov 15 15:27:28 [rsHealthPoll] replSet member a.s1.fs.drive.bru:27021 is now in state DOWN
Thu Nov 15 15:27:29 [rsHealthPoll] replSet info d1.s1.fs.drive.bru:27021 is down (or slow to respond): socket exception [SEND_ERROR]
Thu Nov 15 15:27:29 [rsHealthPoll] replSet member d1.s1.fs.drive.bru:27021 is now in state DOWN
Thu Nov 15 15:27:29 [rsMgr] replSet can't see a majority, will not try to elect self
Thu Nov 15 15:27:31 [rsHealthPoll] replSet member d1.s1.fs.drive.bru:27021 is up
Thu Nov 15 15:27:31 [rsHealthPoll] replSet member d1.s1.fs.drive.bru:27021 is now in state PRIMARY
Thu Nov 15 15:27:31 [rsHealthPoll] replSet member a.s1.fs.drive.bru:27021 is up
Thu Nov 15 15:27:31 [rsHealthPoll] replSet member a.s1.fs.drive.bru:27021 is now in state ARBITER
Thu Nov 15 15:27:32 [rsSyncNotifier] Socket say send() errno:9 Bad file descriptor 10.3.1.12:27021
Thu Nov 15 15:27:32 [rsSyncNotifier] replset tracking exception: exception: 9001 socket exception [SEND_ERROR] for 10.3.1.12:27021
On the other hand, secondary (which of course became primary at some point and then gone back) had not only similar lines about lost connections and election-related messages, but also two very interesting lines:
Thu Nov 15 15:27:26 [rsBackgroundSync] replset 1134533 ops were not applied from buffer, this should cause a rollback on the former
...
Thu Nov 15 15:41:15 [rsBackgroundSync] replset 7806611 ops were not applied from buffer, this should cause a rollback on the former
So, it appear that there should be a rollback, but there is no "rollback" directory (permissions are fine and logs are silent on both servers), and there are no rollback-related records on the primary, so it appears that the data just vanished.
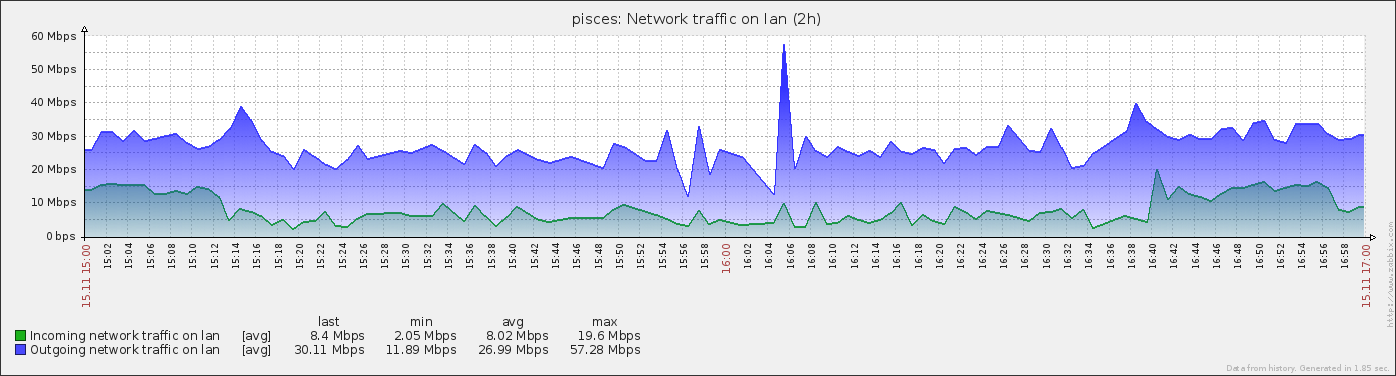
Also, analyzing historical monitoring graphs and matching missing fs.chunks with upload timestamps, we found out that missing data always corellates with failover that is caused by overloaded I/O triggered by shard chunk migration, so this problem existed in 2.0.7 too.
Now, let me get to the point.
I understand that w:majority is a must for robust operation where one cannot afford rollbacks and manual reconcilation, usually associated with conflicts that might be impossible to correctly resolve. Still, since this database only gets inserts and (occasional) deletes, I presumed that even if rollback happens, I just would run a mongorestore on it as usual. Also, existing documentation points out that rollback does not lead to data loss (see http://www.mongodb.org/display/DOCS/Replica+Sets+-+Rollbacks) by itself, only to manual reconciliation (which in our case would just be adding the rolled back data back to the database). Unfortunately, in our case it appears that rollback failed to properly occur for unknown reason, leading to large amounts of lost data (also, I'm not 100% sure if w:majority would be 100% safe in case it's a bug).
So I guess it's either a misunderstanding how MongoDB works from our side, a documentation deficiency or a very nasty bug.
Of course, my analysis might be completely wrong. I still have logs (can backup them before they get rotated out, tell me if you would like to have a look) and can make a mongos config server dump. Dumping the database itself or its oplog would be problematic though, while it doesn't contain private data, it's too large to move it over anything except LAN.
As for recovery – while I know what steps I should take (manually replaying oplog with some kind of a pre-scan optimzation like not trying to replay inserts that get deleted later) I think it's unfeasible, since our current oplog is about 200GB per shard RS member and matching about nine million oplog records would overload the server. Maybe you have any advice?

- is related to
-
-

- Closed
-