-
Type:
Bug
-
Resolution: Duplicate
-
Priority:
 Major - P3
-
None
-
Affects Version/s: 5.0.12
-
Component/s: None
-
Product Performance
-
ALL
-
- run ycsb workload in default configuaration
- setting taskExecutorPoolSize to 8 will cause a greate performance decrease
- Compile with use-diagnostic-latches to off will cause a performance increate
-
(copied to CRM)
-
None
-
None
-
None
-
None
-
None
-
None
-
None
Recently, a production cluster(WT 5.0 Version) come across a serious performance decrease when performing pure read workload. Using YCSB benchmark, we reproduce the problem.
Environment Setup
Linux Kernel Version is 5.4.119.
A sharded cluster(WT 5.0 Version) with three 8-cores 16-GB Mongos and five shards each with 8-cores 16-GB Mongod, a 1-core 2-GB ConfigSvr Replica. Using YCSB workload, we set {{
{field0: 1}}} as shard key, and perform point query based on _id (We query a key which is not shard key). According to our debugging and testing, we found some fun facts: The performance dropping is caused by taskExecutorPoolSize configuration. Based on our experience, this configuration should be set to the number of cpu cores, which is surprised to harm the performance.
| point search shard key | point search non-shard key | |
|---|---|---|
| taskExecutorPoolSize: 1 | 5836.91 QPS | 2770.74 QPS |
| taskExecutorPoolSize:8 | 5279.16 QPS | 1508.33 QPS |
Flame Graph Analysis
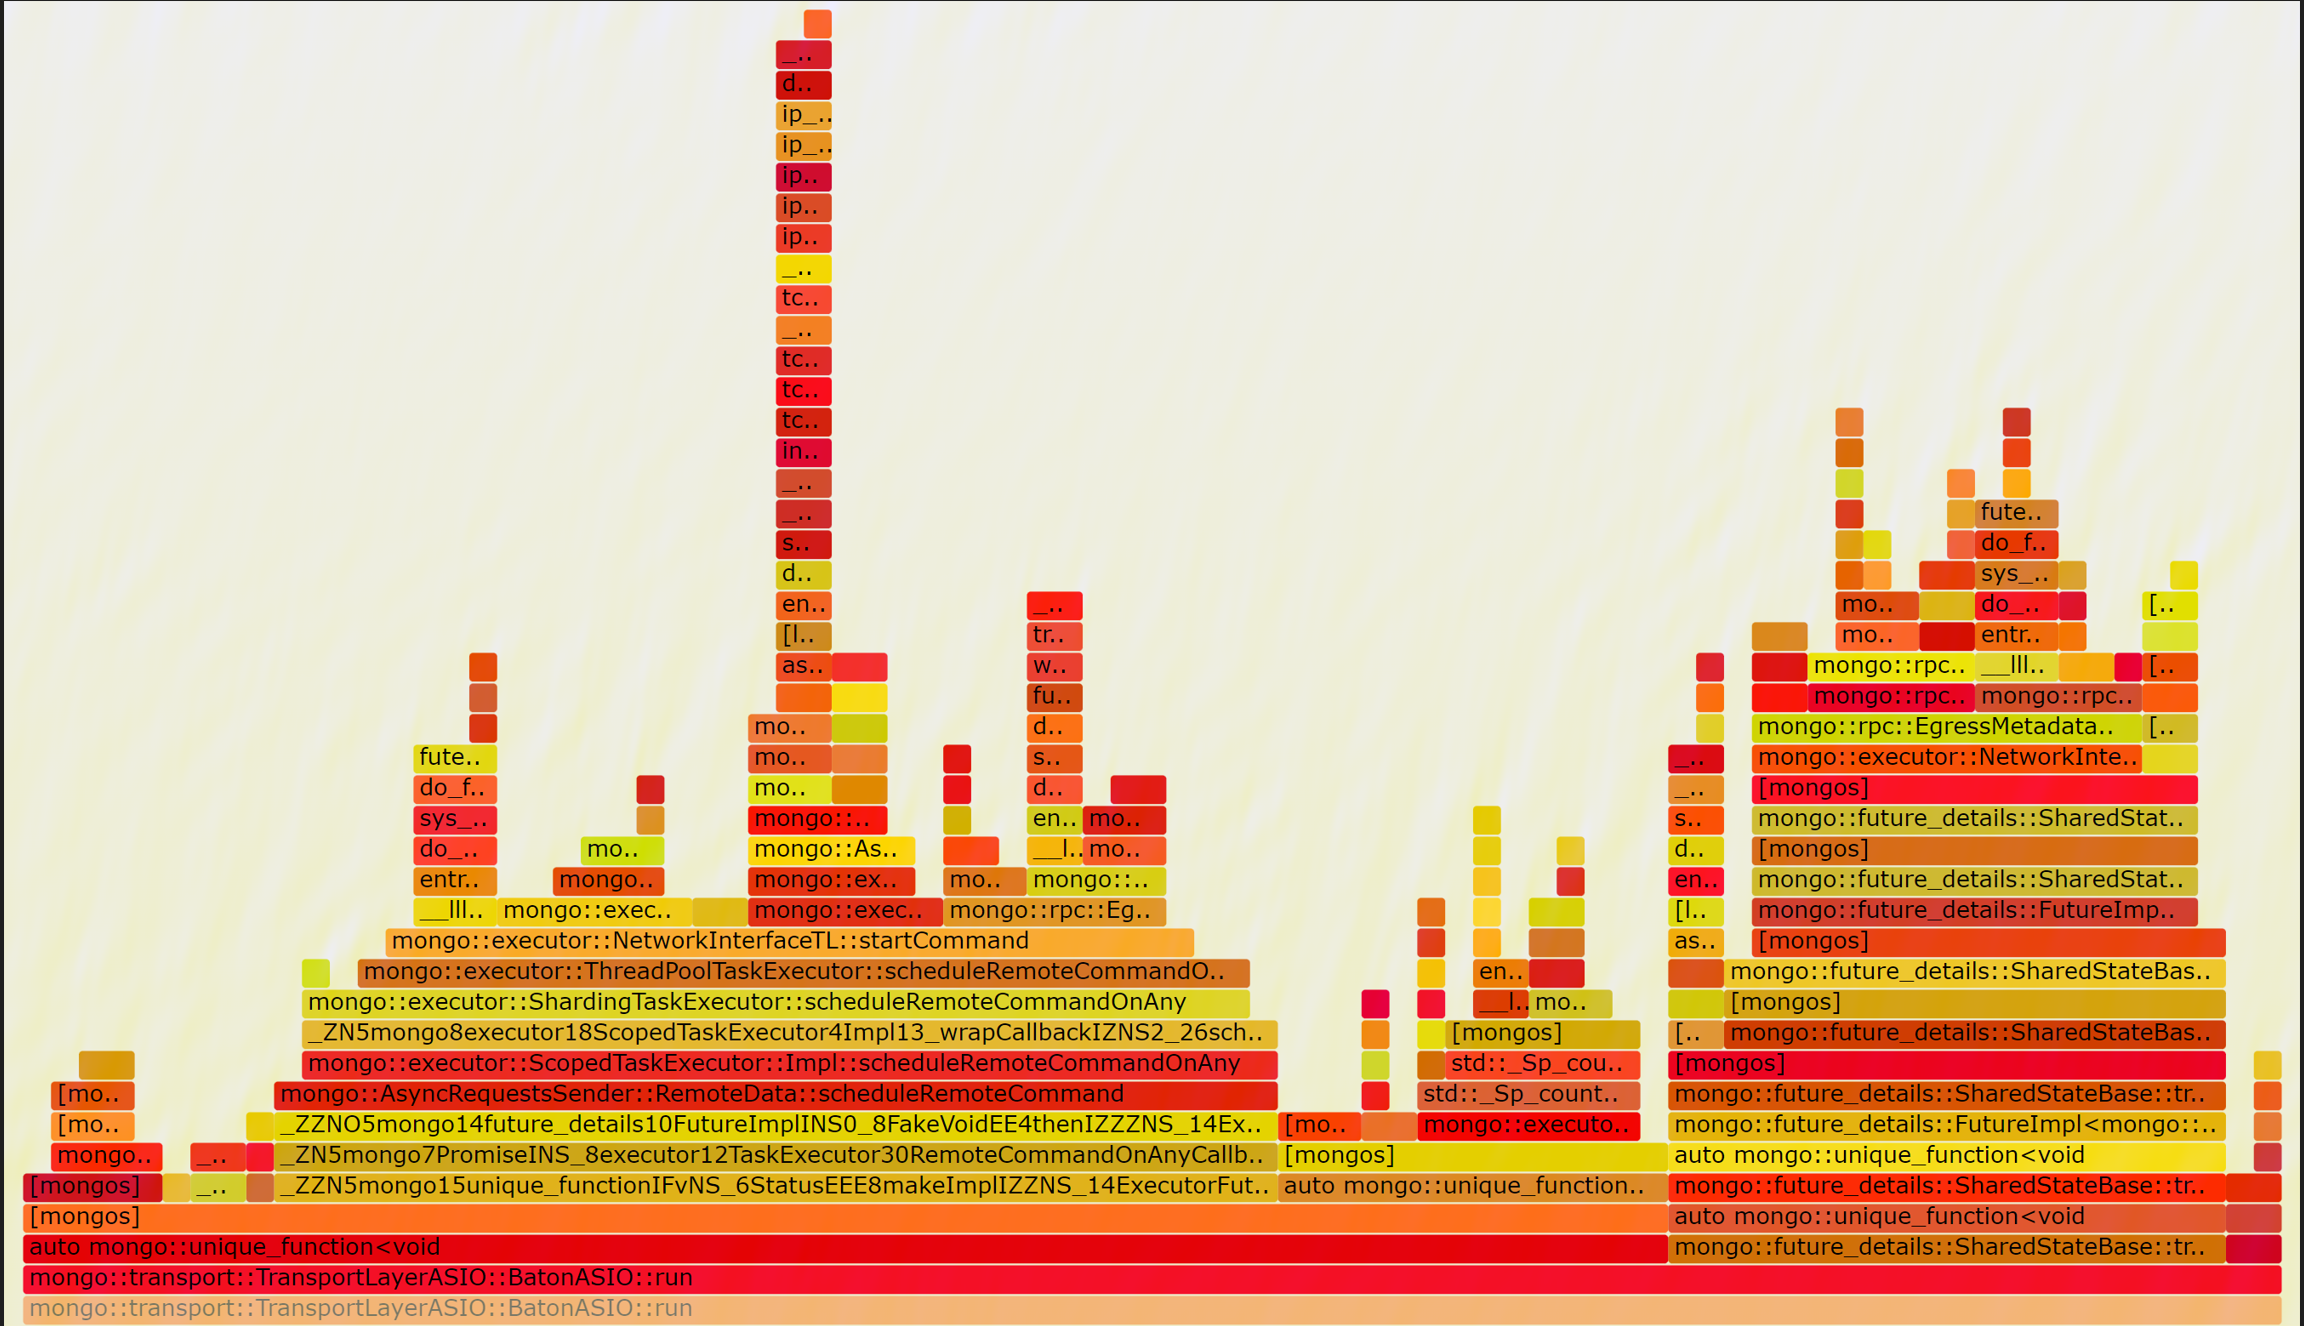
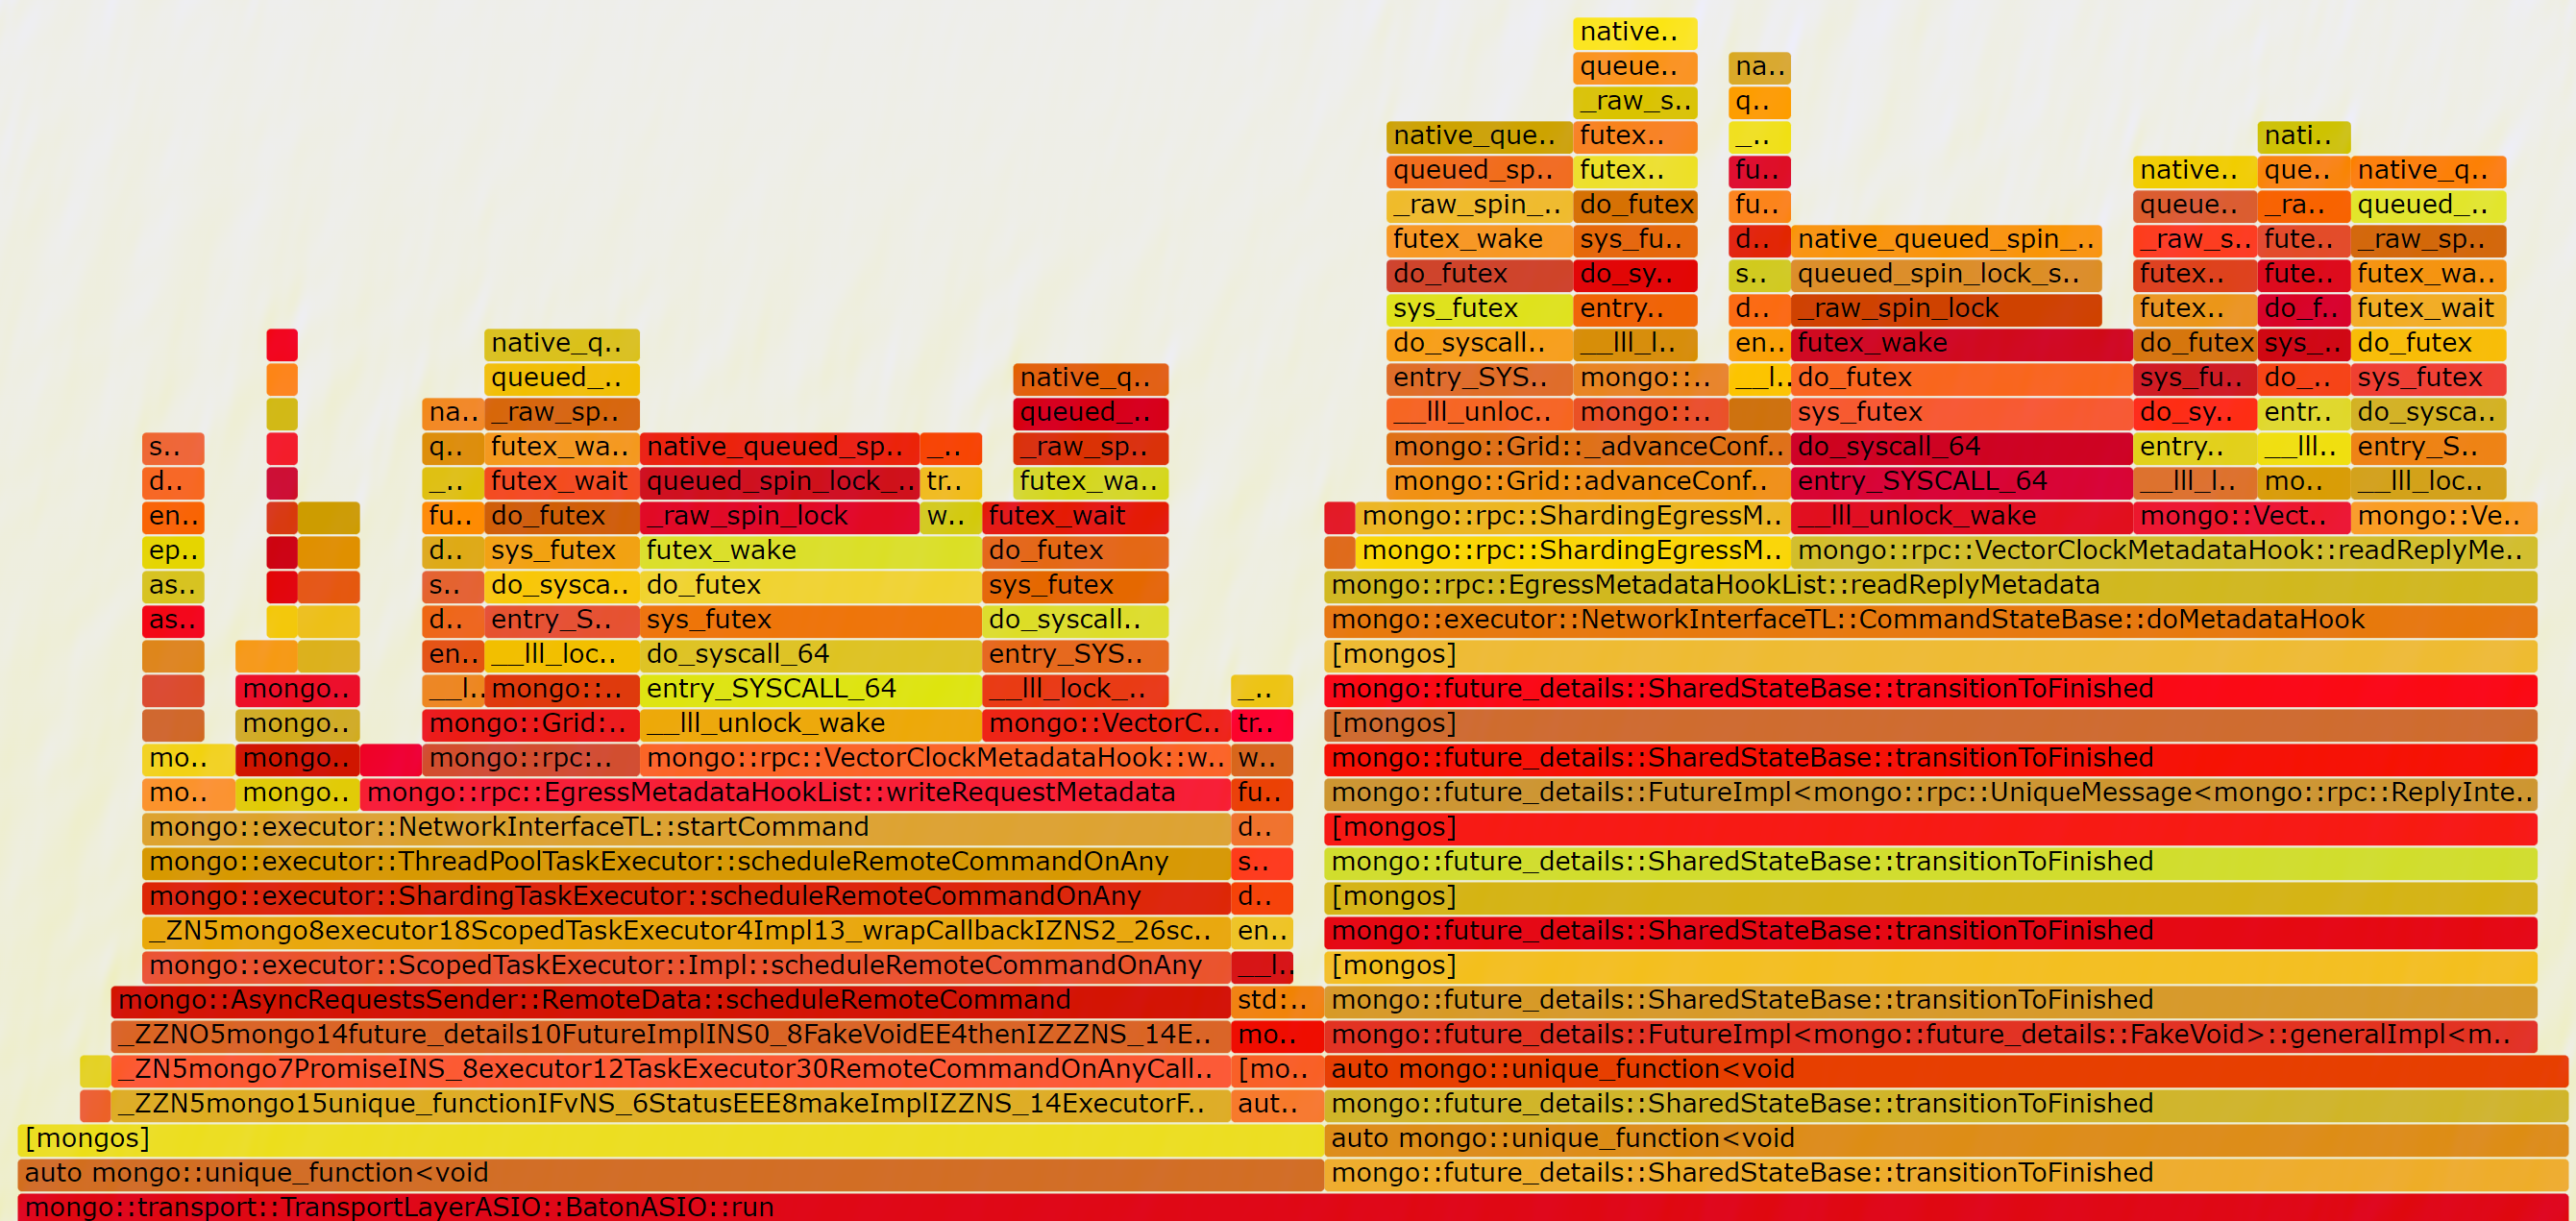
We further record the flame graph, here is the result:
When setting taskExecutorPoolSize to 8, there seem existing heavy lock contention

nearly every function call will invoke native_queued_spin_lock_slowpath which wastes too much cpu to do useless works.

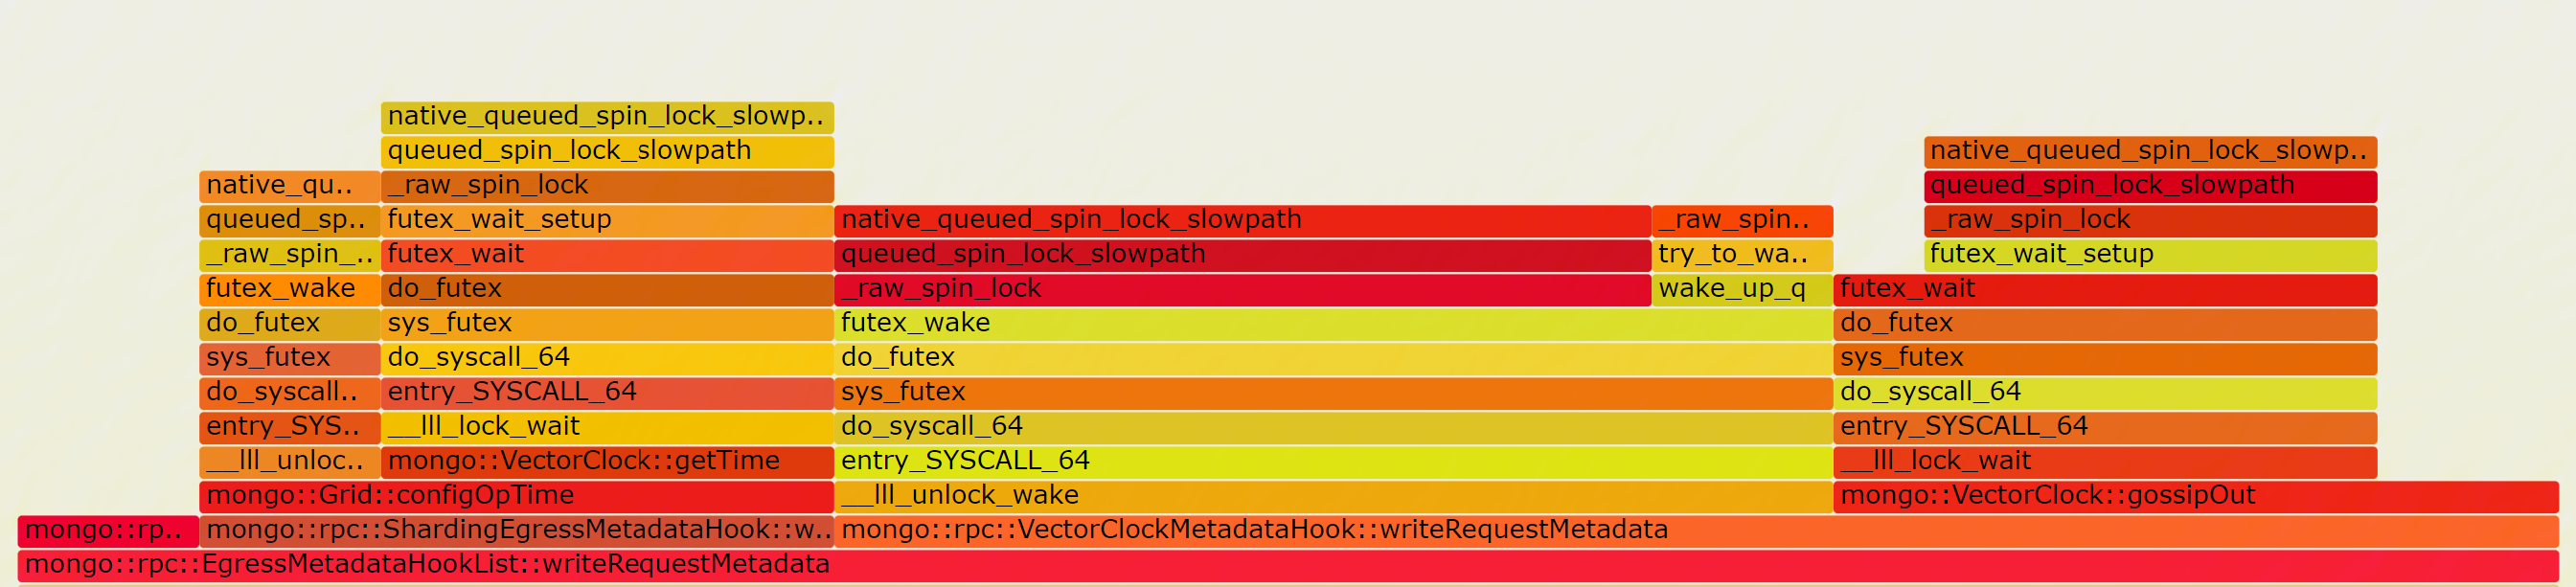
When setting taskExecutorPoolSize to 1, things getting better
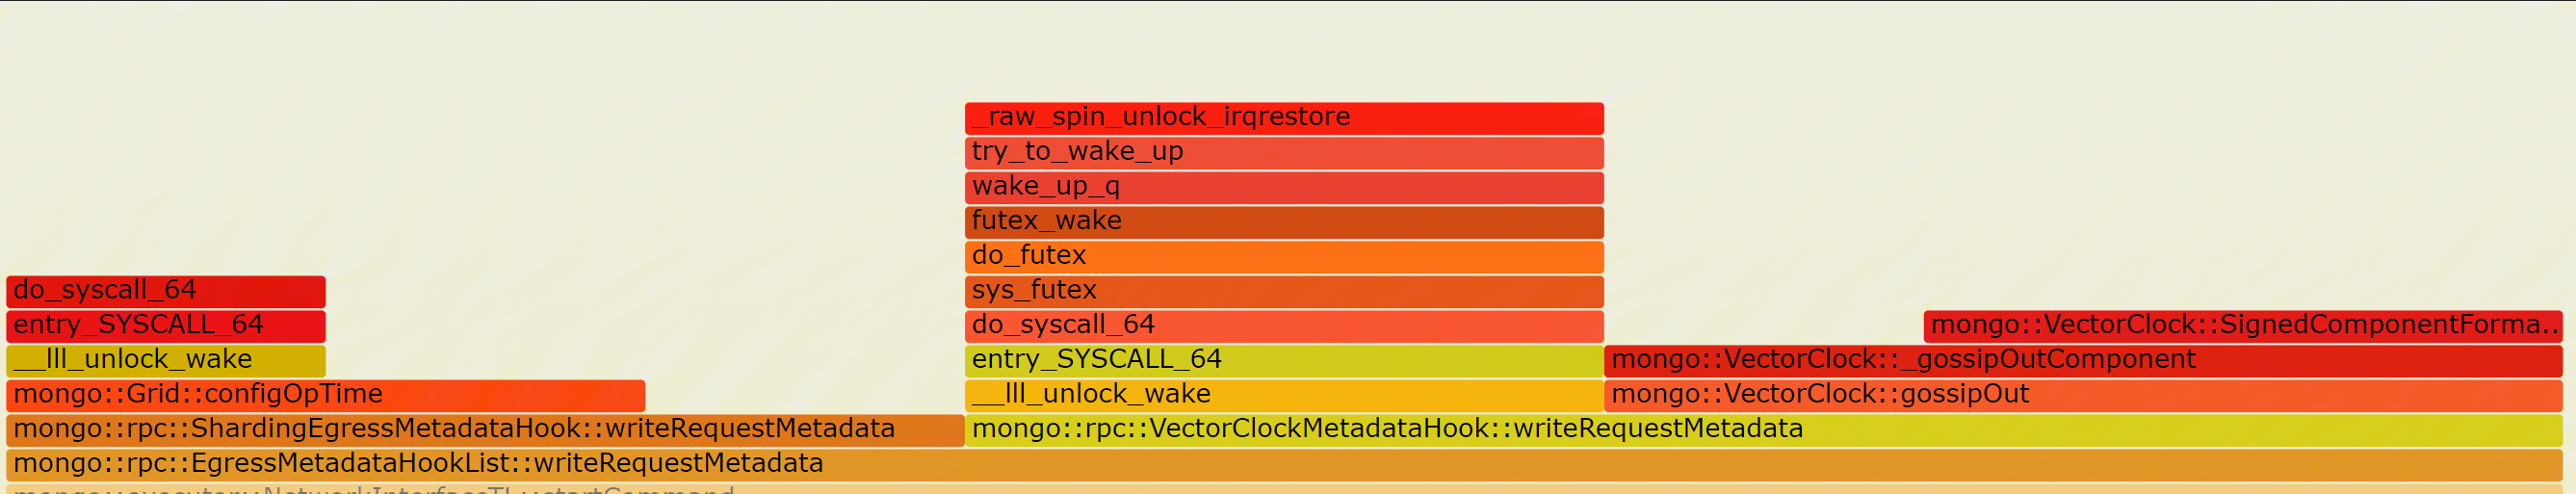
The lock content drop significantly, and SYSBENCH QPS improves from 1508.33 to 5279.16, but this is still far from our expectation, since WT 4.0 can achieve 13000+ QPS for this workload. So we further found this code block
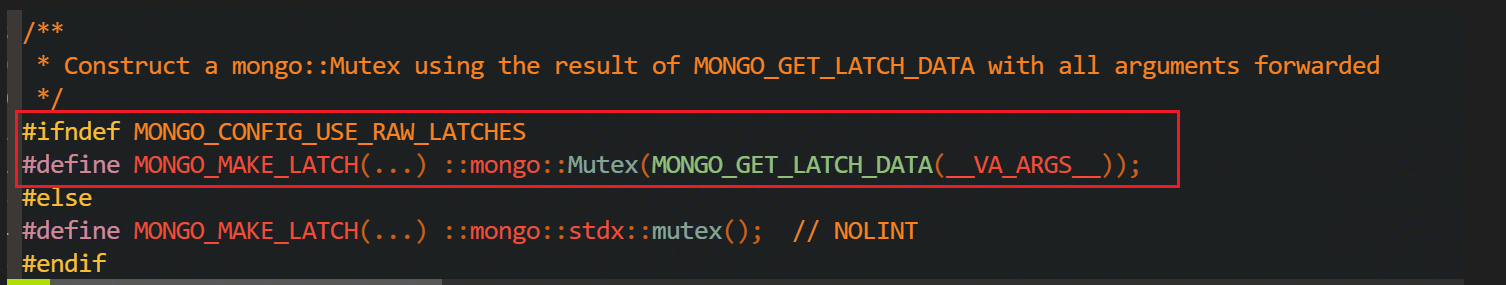
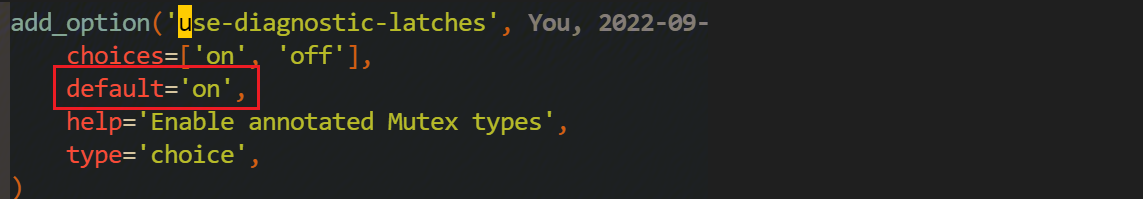
WT 5.0 set use-diagnostic-latches default to on which will use detail_latch::Mutex, but WT 4.0 use linux raw mutex. So we change this option to off for further testing, and find that greatly improves the performance too.
| point search on shard key | point search on non-shard key | |
|---|---|---|
| taskExecutorPoolSize: 1 | 24536.23 QPS | 10790.01 QPS |
| taskExecutorPoolSize:8 | 22579.78 QPS | 8044.38 QPS |
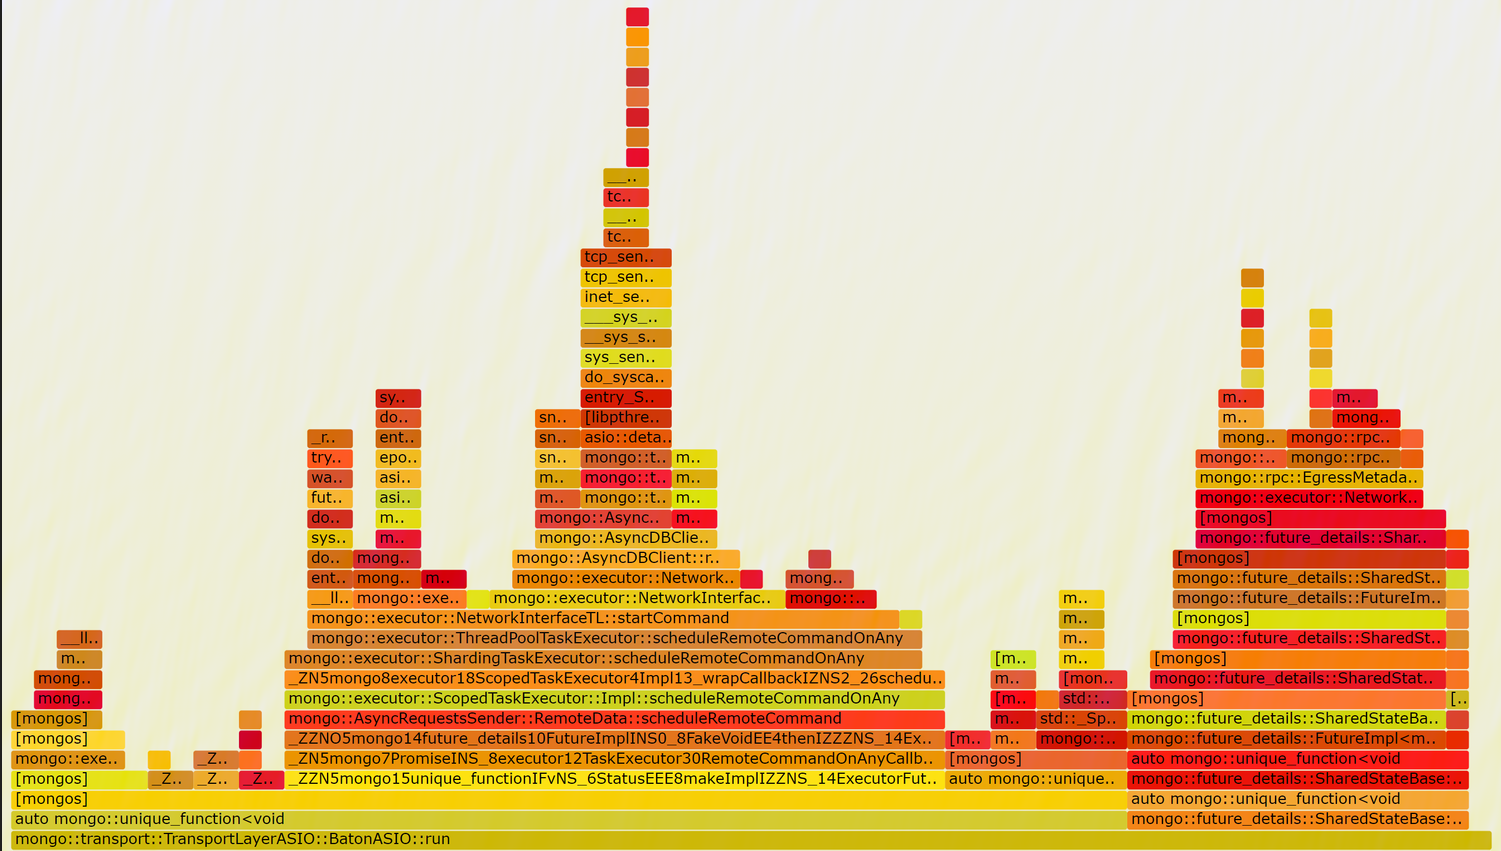
We further analyze the flame graph when setting use-diagnostic-latches to off
when setting taskExecutorPoolSize to 1, there are nearly no lock contention exists, and performance is the greatest. 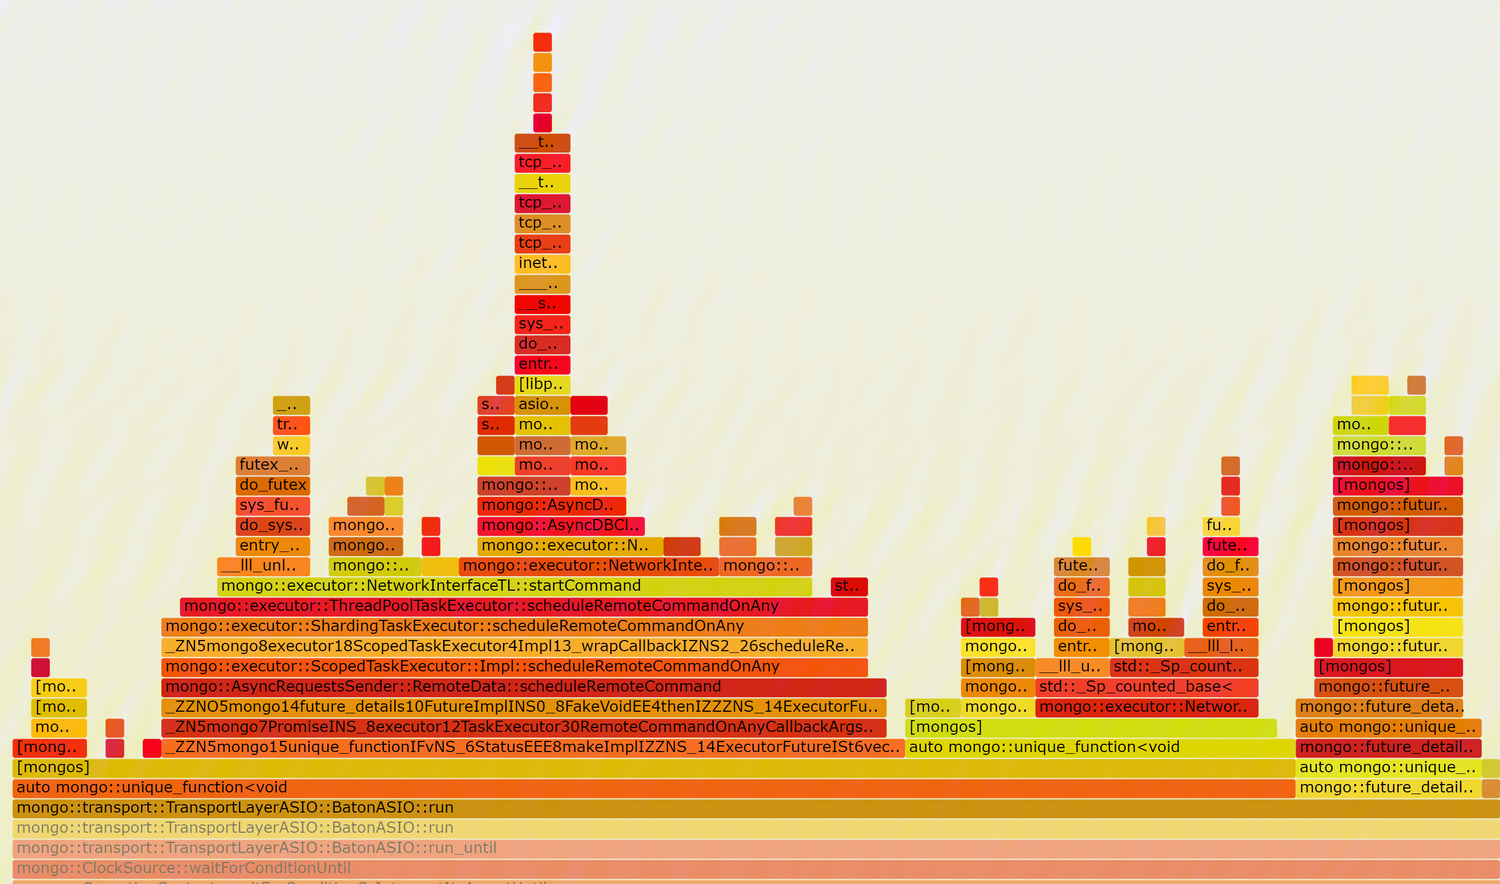
when setting taskExecutorPoolSize to 8, performance also increase but lower than above.

Conclusion
Based on production cluster analysis and YCSB testing, we find two fact:
- Although setting taskExecutorPoolSize to the number of cores is advised prior to WT 4.2, Setting taskExecutorPoolSize to 1 will gain the best performance in WT 5.0.
- Using Linux default mutex gain the best performance, latch_detail::Mutex wrapper class harms performance greatly.
Question
- According to this jira, is it recommanded to set taskExecutorPool to 1 to gain the best performance under most circumstances?
- After WT 4.0, why add use-diagnostic-latches option to introduce a mutex wrapper which seems increasing lock contention and harming the performance? Should we leave it off in production environment to gain better performance?
- Can explain why setting taskExecutorPool greater than 1 will cause such a difference?


- duplicates
-
-
- Closed
-