-
Type:
Improvement
-
Resolution: Unresolved
-
Priority:
 Major - P3
-
None
-
Affects Version/s: None
-
Component/s: None
-
None
-
Query Execution
-
None
-
None
-
None
-
None
-
None
-
None
-
None
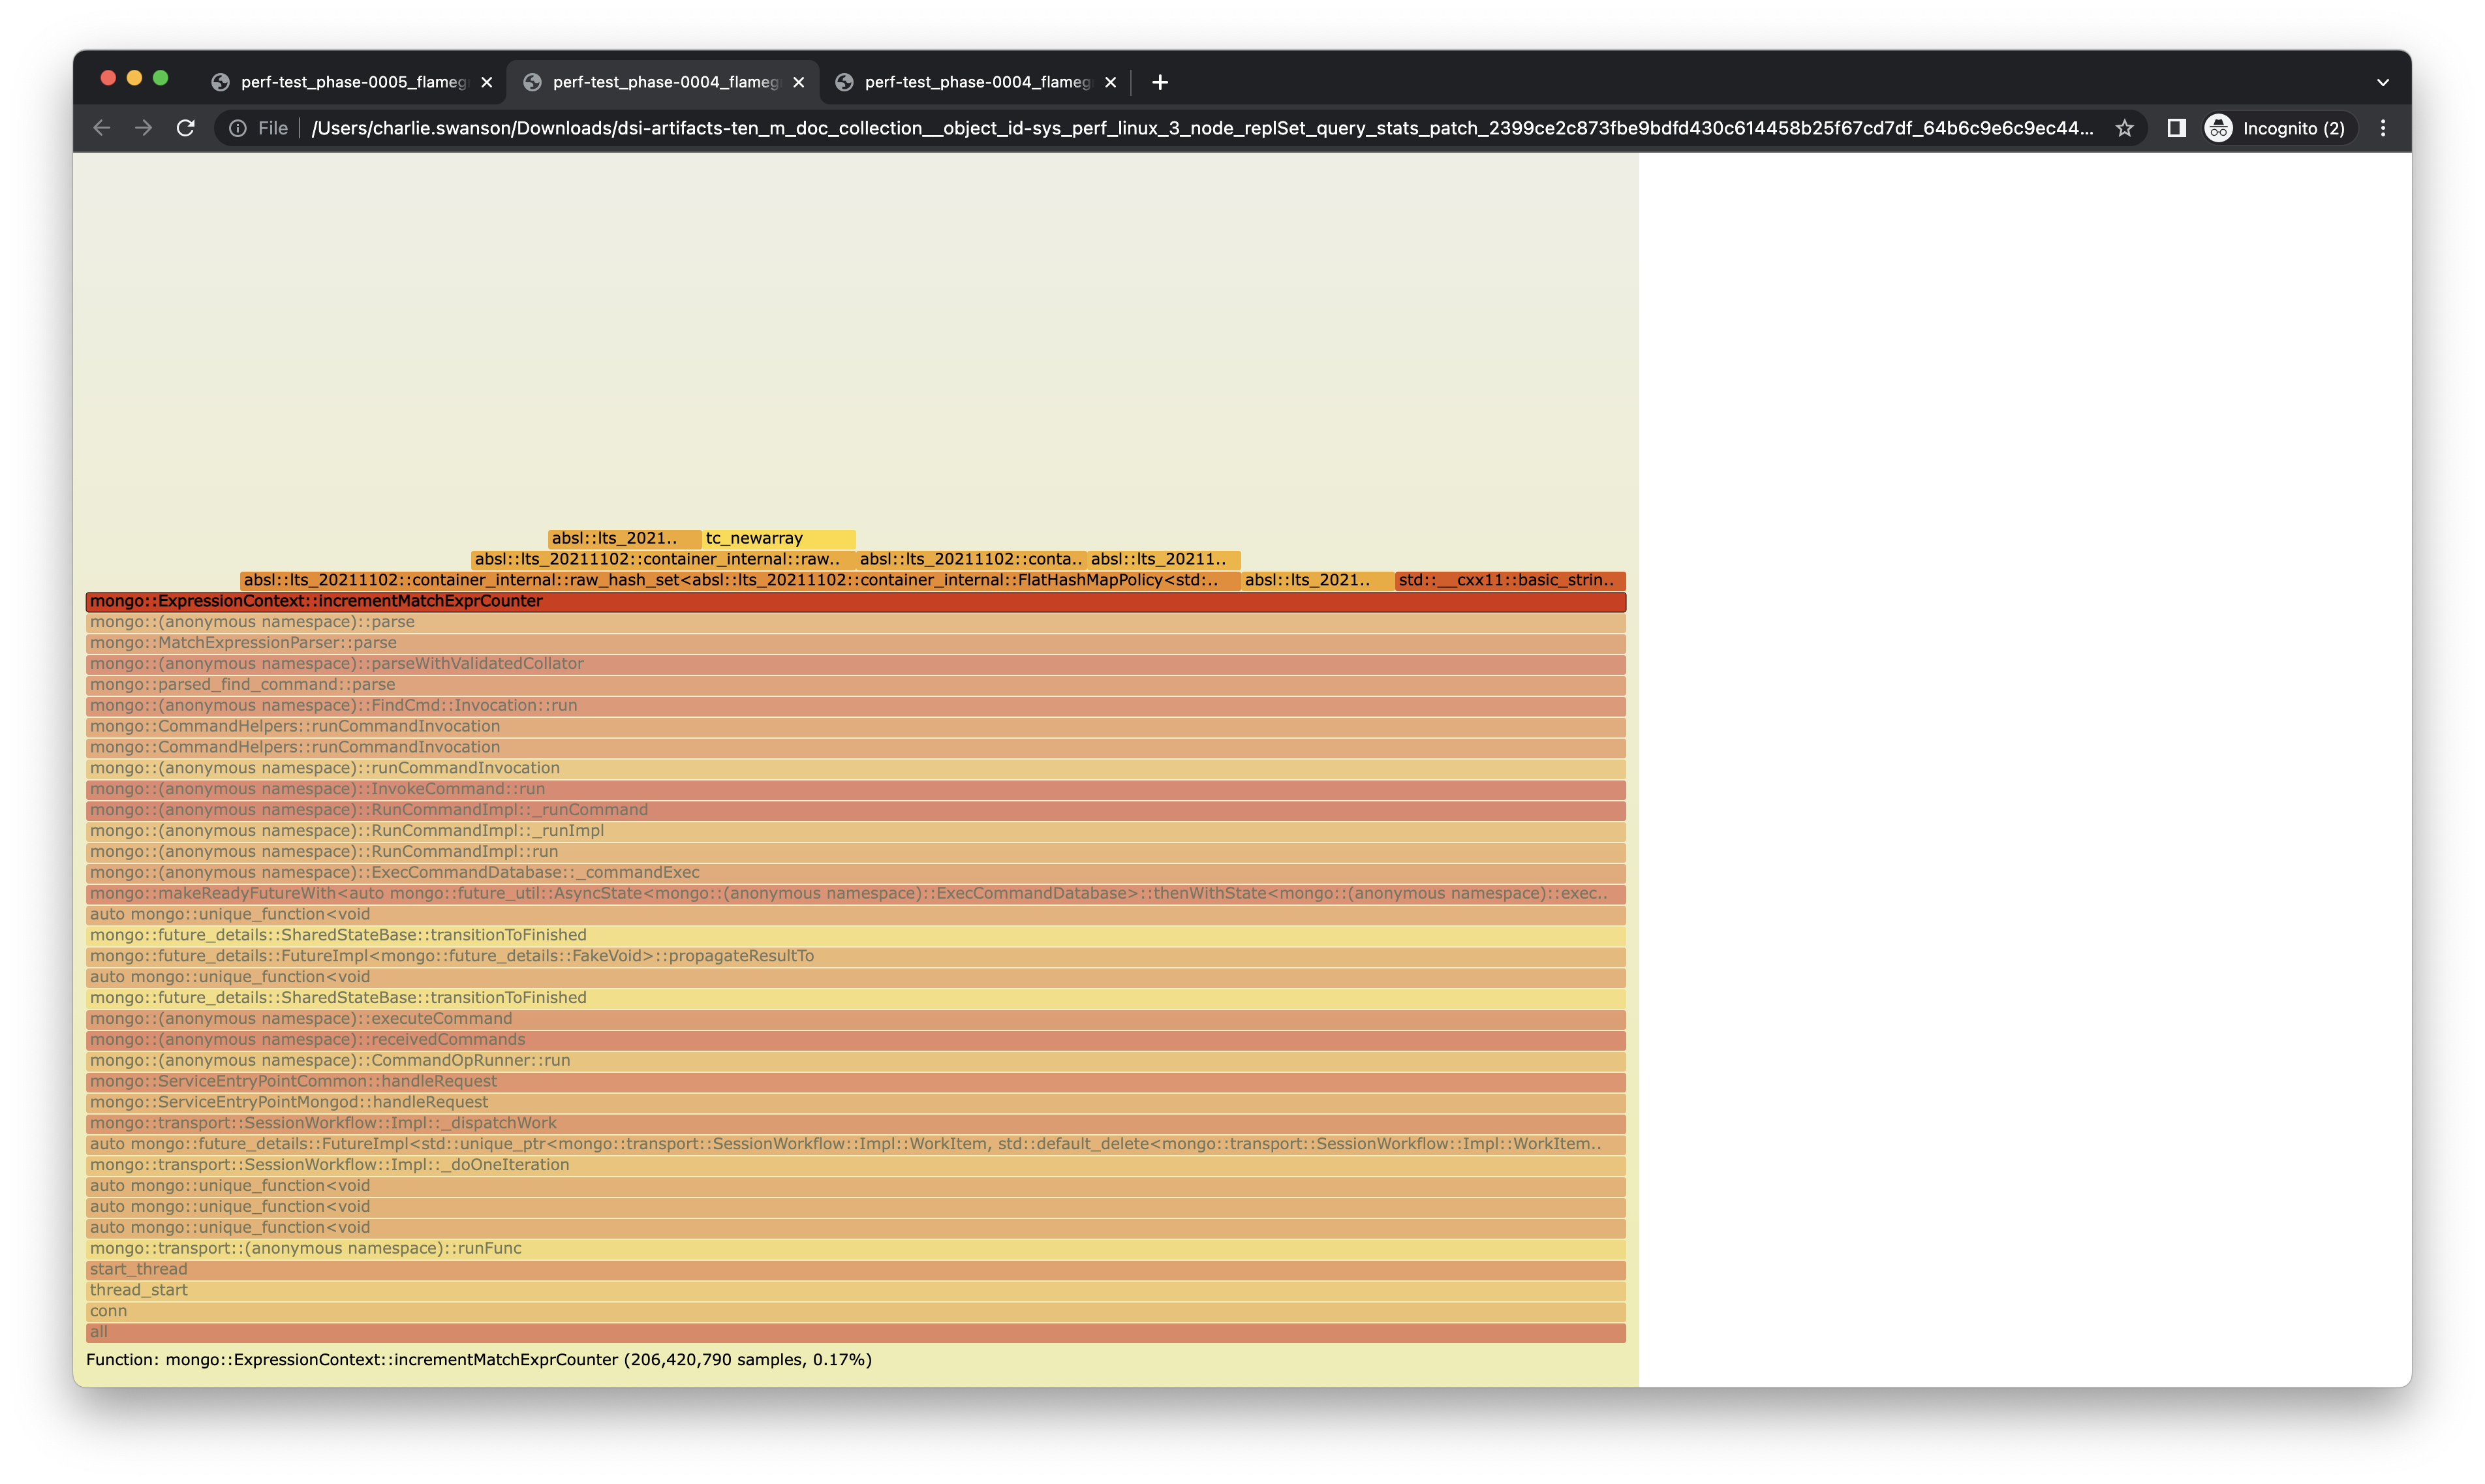
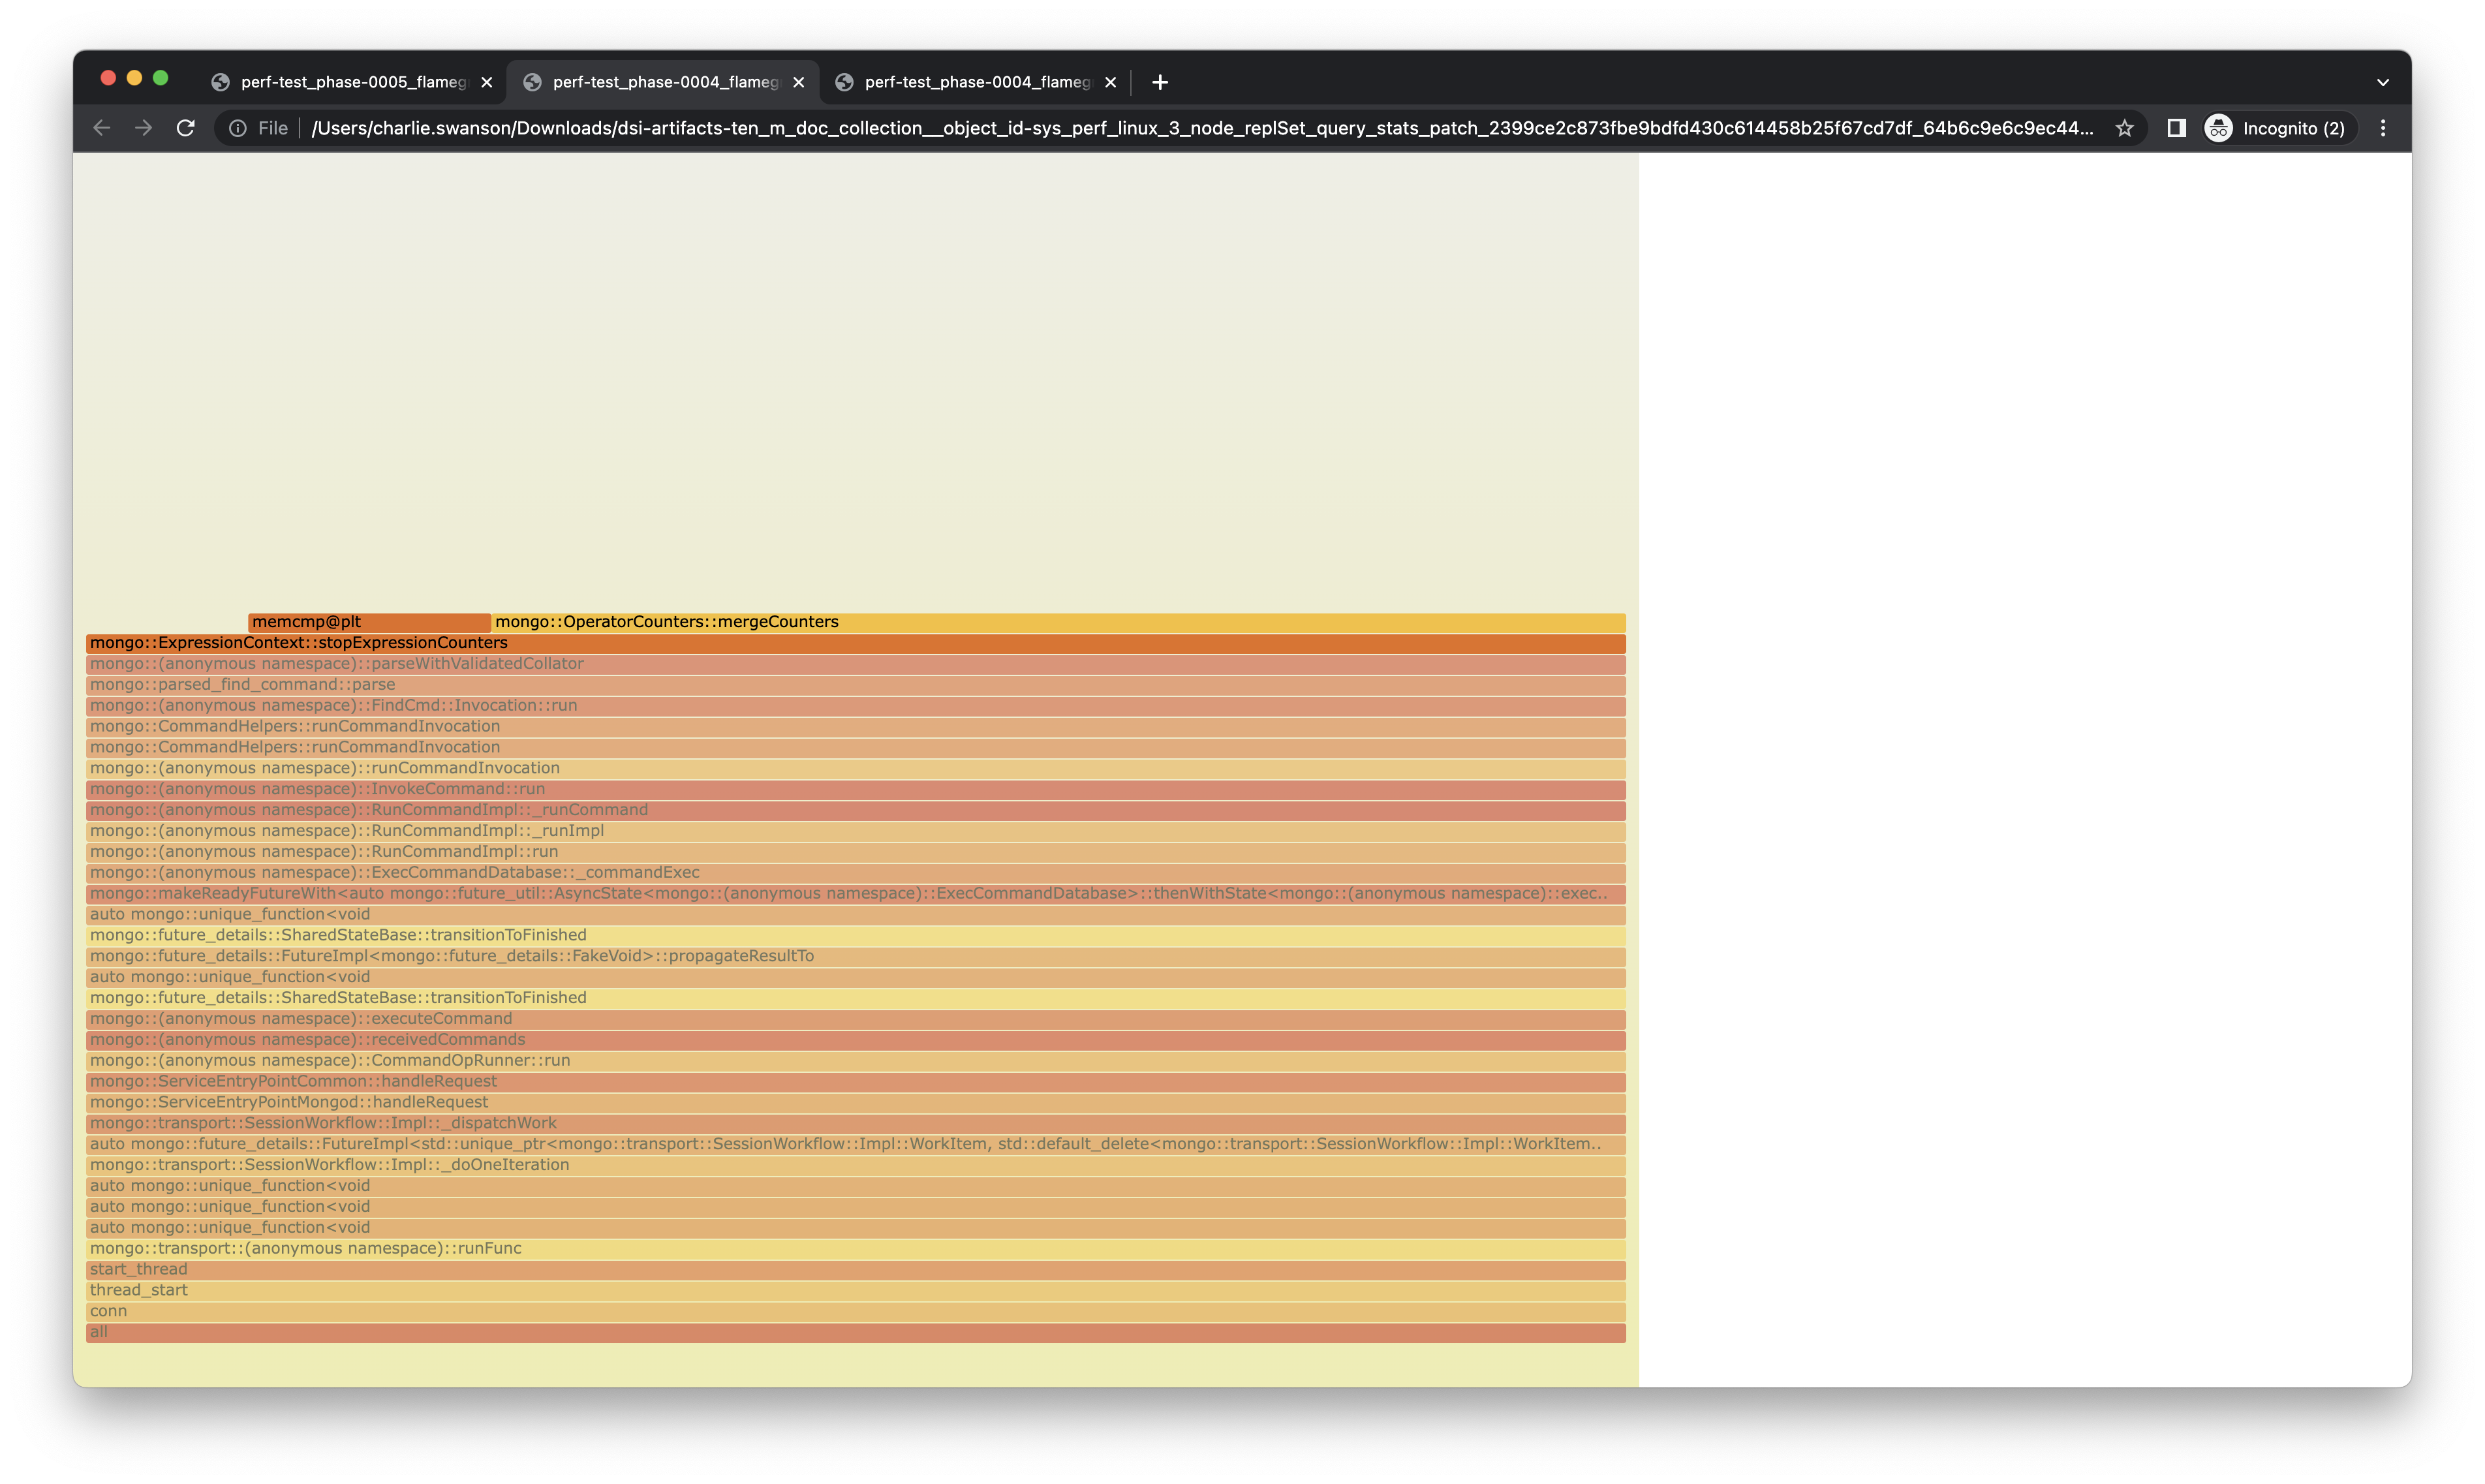
I noticed 'incrementMatchExprCounter' and 'stopExpressionCounters' in some flame graphs (attached). It was only about 0.16% and 0.17% of the time for IDHACK workloads, but I was still surprised it showed up at all. When I looked into it, it seems that it's using atomic counters and allocating some memory for each one. I imagine some of this is for convenience with hooking into FTDC counters, but I thought that there must be a more efficient way to do it, and probably also we could back off some of the exactness and accept an approximate count to lower the overhead - we are only looking at these for usage metrics after all.
See these two other posts which inspired me: Approximation Pattern: replace 100% of threads increments by 1 with 1% of threads incrementing by 100 and this paper from SIGMOD (poster) which suggests splitting hot counters into many discrete counters to help with concurrency.
That last one is probably overkill here, but seemed topical.
- is related to
-
SERVER-85107 Tracking: Performance is "good enough"
-
- Closed
-