-
Type:
Task
-
Resolution: Unresolved
-
Priority:
 Major - P3
-
None
-
Affects Version/s: None
-
Component/s: None
-
Catalog and Routing
-
2
-
None
-
None
-
None
-
None
-
None
-
None
-
None
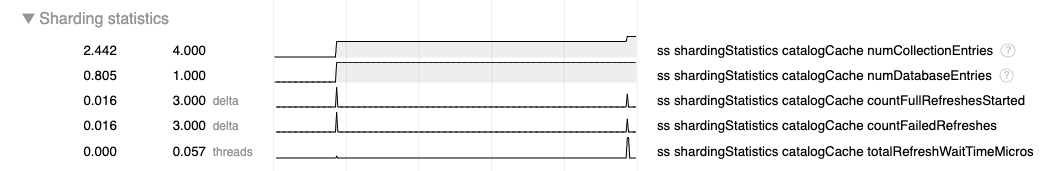
The serverStatus command and the FTDC data files report general statistics on the server. As part of this, there is a section dedicated to the Catalog Cache:
 shardingStatistics : {
  ...
   catalogCache : {
      numDatabaseEntries : Long("<num>"),
      numCollectionEntries : Long("<num>"),
      countStaleConfigErrors : Long("<num>"),
      totalRefreshWaitTimeMicros : Long("<num>"),
      numActiveIncrementalRefreshes : Long("<num>"),
      countIncrementalRefreshesStarted : Long("<num>"),
      numActiveFullRefreshes : Long("<num>"),
      countFullRefreshesStarted : Long("<num>"),
      countFailedRefreshes : Long("<num>")
   }
...
}
In case of the FTDC file, this information can be graphically represented by T2:
One goal of this ticket is to identify metrics that can be considered useful and clear for investigating the behavior of the Catalog Cache (i.e., it shouldn't need to be a Sharding expert to interpreter these metrics).
Ideally, for both collection and database metadata, we would need (TBD):
- number of the entries in the cache (TBD: stale and non-stale?)
- number of cache misses (TBD: and cache hits?)
- number of incremental refreshes started/completed (only for collection metadata)
- number of full refreshes started/completed
- number of failed refreshes
- time spent waiting for refreshes (in milliseconds)
On the other hand, T2 should be fixed and/or improved to represent this information in the best way (for example, it currently shows threads as unit of the totalRefreshWaitTimeMicros metric, which is a definitely a bug). Consequently, some tickets for the Server Triage & Release team should be created as a part of this work.

- is depended on by
-
-
- Blocked
-
-
-
- Blocked
-
- is related to
-
-
- Closed
-