-
Type:
Task
-
Resolution: Unresolved
-
Priority:
Minor - P4
-
None
-
Affects Version/s: None
-
Component/s: Cache and Eviction
-
None
-
Storage Engines - Transactions
-
StorEng - Defined Pipeline
-
None
In examining some YCSB workloads, I've observed that they sometimes have surprising amounts of IO.
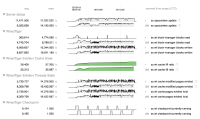
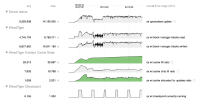
The following FTDC is from a recent (8.1) run of a 100% update YCSB workload on an in-cache data-set.

The point of interest here is that the data set fits comfortably in the cache, as seen in the cache fill metrics. (I believe the total data size is ~5GB. The WT cache is configured to 15GB.) But despite that, the WT block manager is consistently issuing thousands of reads per second.
In fact, we are issuing about one read for every two updates, which at first blush seems crazy.
The goal of this ticket is to understand why we read so much data in this workload. What is WT reading? Why is it reading it? Should WT be doing these reads, or can we optimize them out?
I've attached the full FTDC as ftdc.tgz.


