-
Type:
Improvement
-
Resolution: Done
-
Priority:
 Major - P3
-
None
-
Affects Version/s: None
-
Component/s: None
-
None
-
None
-
None
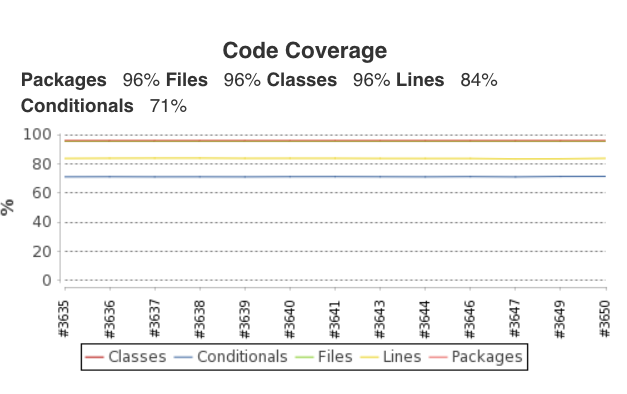
In WiredTiger Jenkins CI we used to have a job that periodically generates reports about testing coverage, and used a Jenkins plugin to visualize and graph the coverage dynamics over time. After migrating the testing coverage job to Evergreen, we were still able to generate the coverage reports, but lost the graphing capability for the reports. It's worth investigating how to achieve the same functionality in Evergreen.