-
Type:
Bug
-
Resolution: Done
-
Priority:
 Critical - P2
-
Affects Version/s: 3.0.6, 3.0.7
-
Component/s: Performance, WiredTiger
-
None
-
Fully Compatible
-
None
-
0
-
None
-
None
-
None
-
None
-
None
-
None
-
None
Setup:
- 3.0.6
- two shards, each standalone mongod
- shard key is _id (not hashed), using standard default ObjectIDs.
- WT cache size 10 GB
- single ttl collection set to expire documents after 10 minutes
- 4 threads inserting 1 kB documents into the ttl collection
After about 25 minutes of run time (about 15 minutes after ttl deletions started) one of the shards became completely stuck. Stack traces captured after it became stuck are attached:
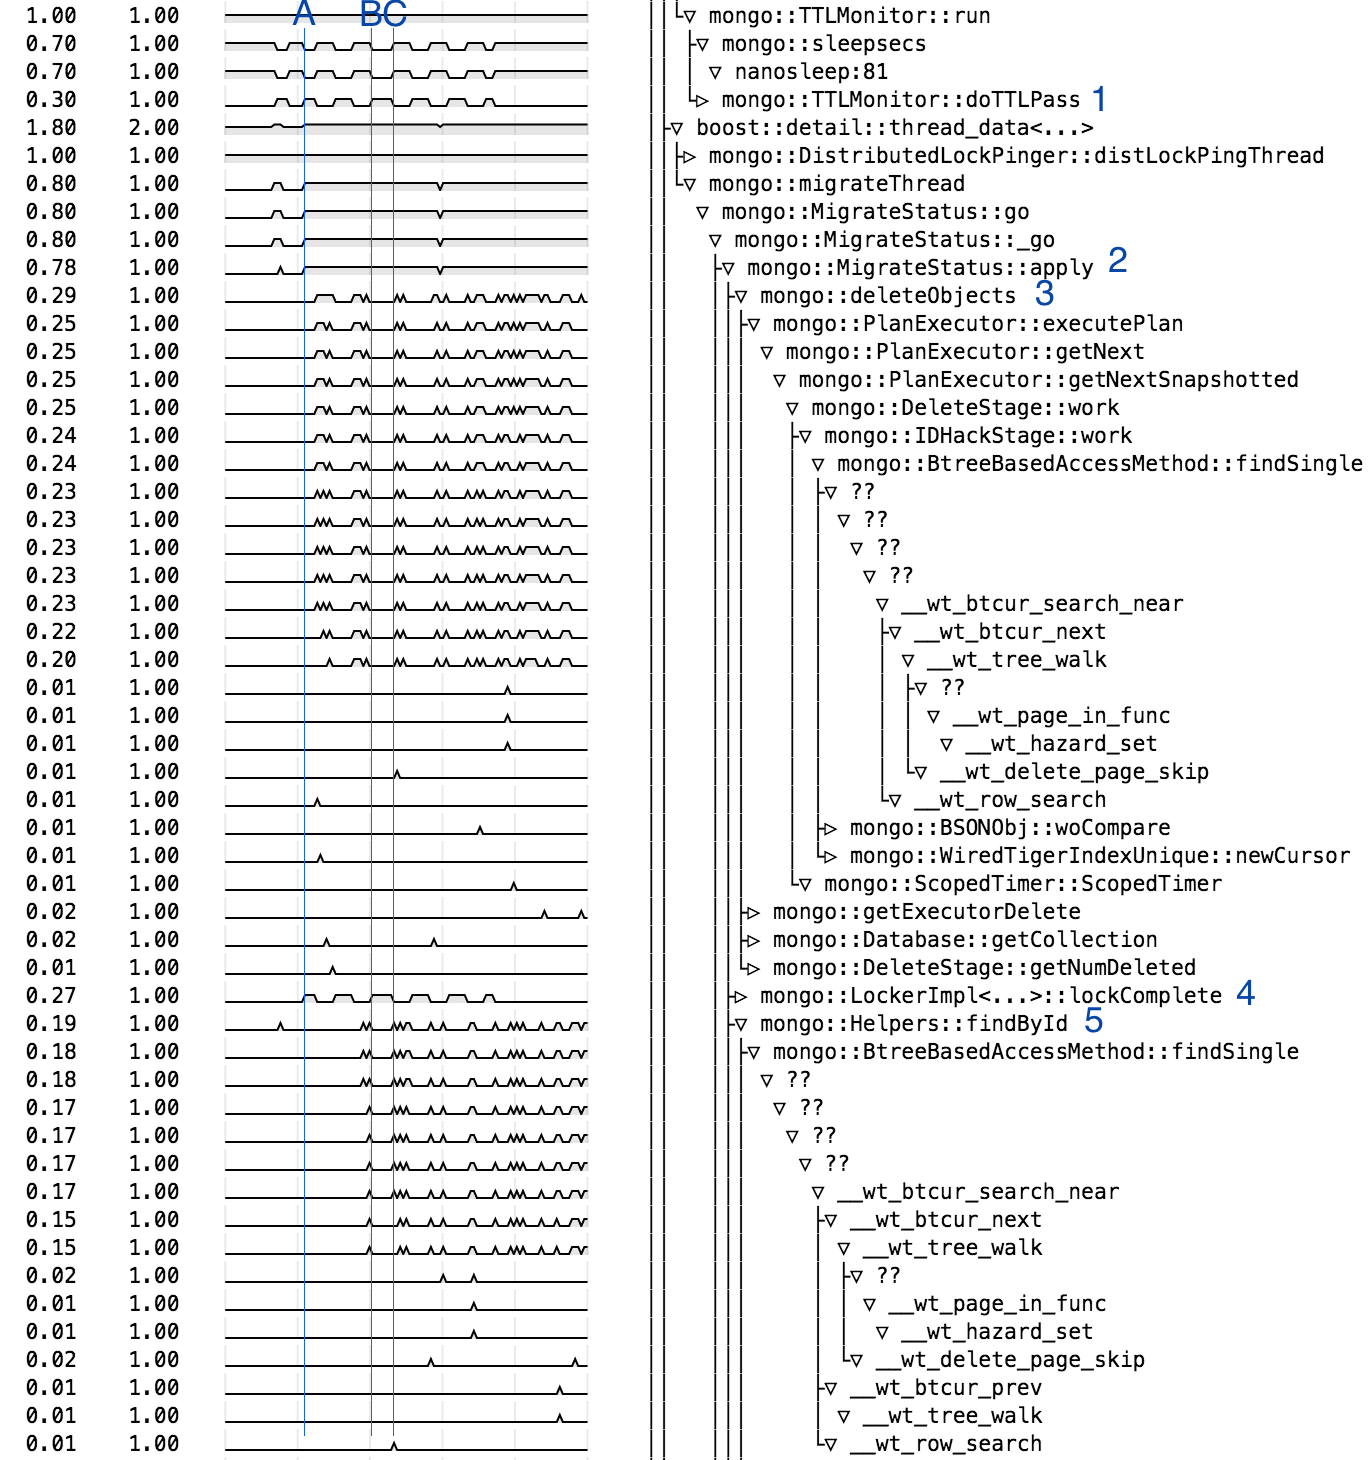
- TTLMonitor, splitVector, serverStatus are all stuck waiting for full cache:
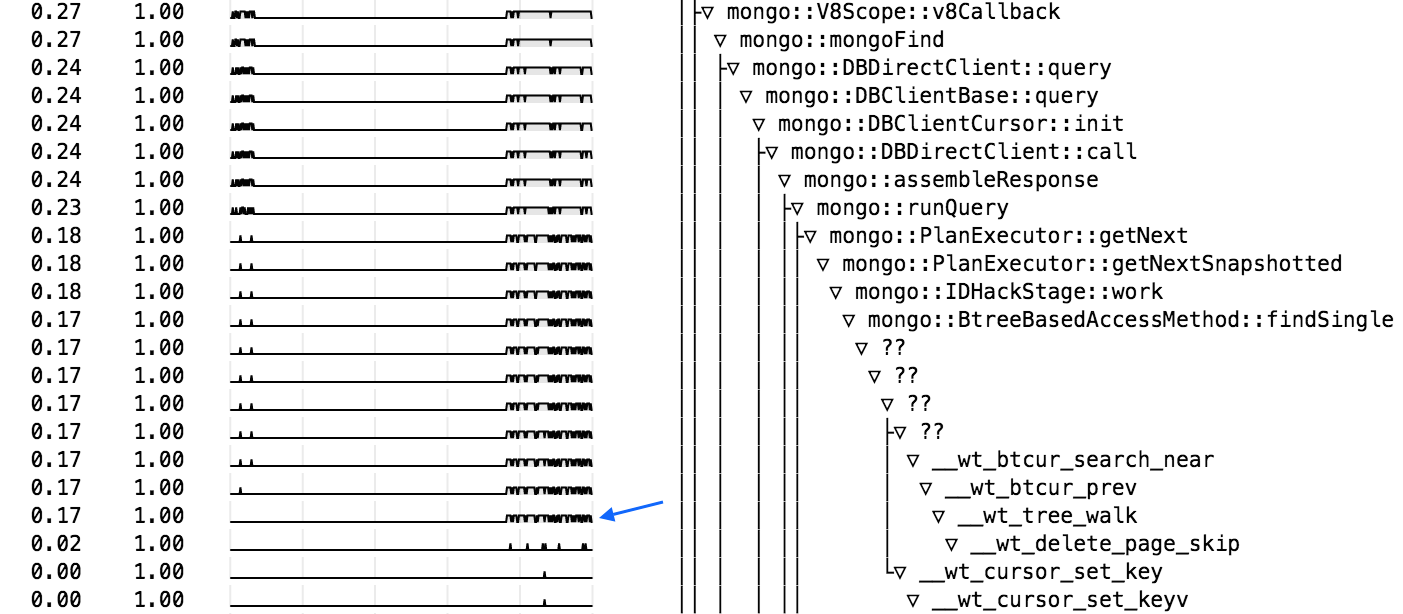
- TTLMonitor is stuck in __wt_page_in_func while traversing the collection
- serverStatus and splitVector are both stuck in WT somewhere within mongo::WiredTigerRecoveryUnit::_txnOpen - why would a transaction open be stuck waiting for a full cache?
- no sign of any eviction activity (or of the eviction worker threads, but maybe they're hidden in the "??" call sites?).
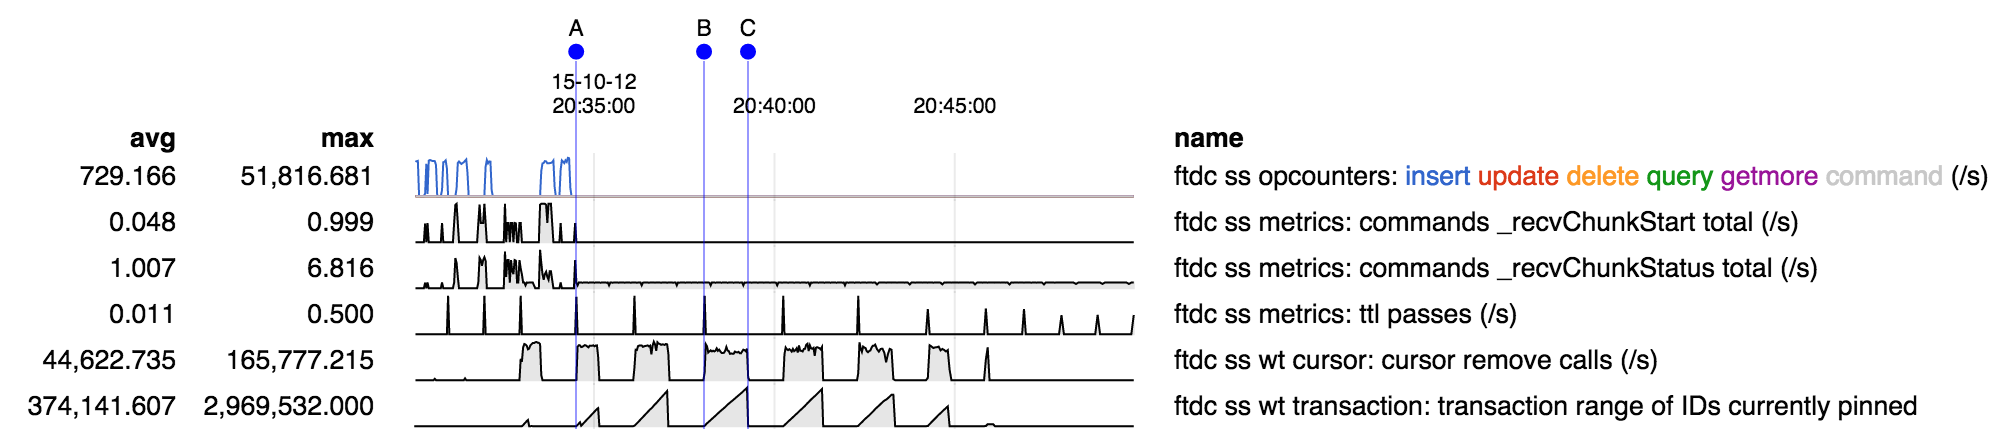
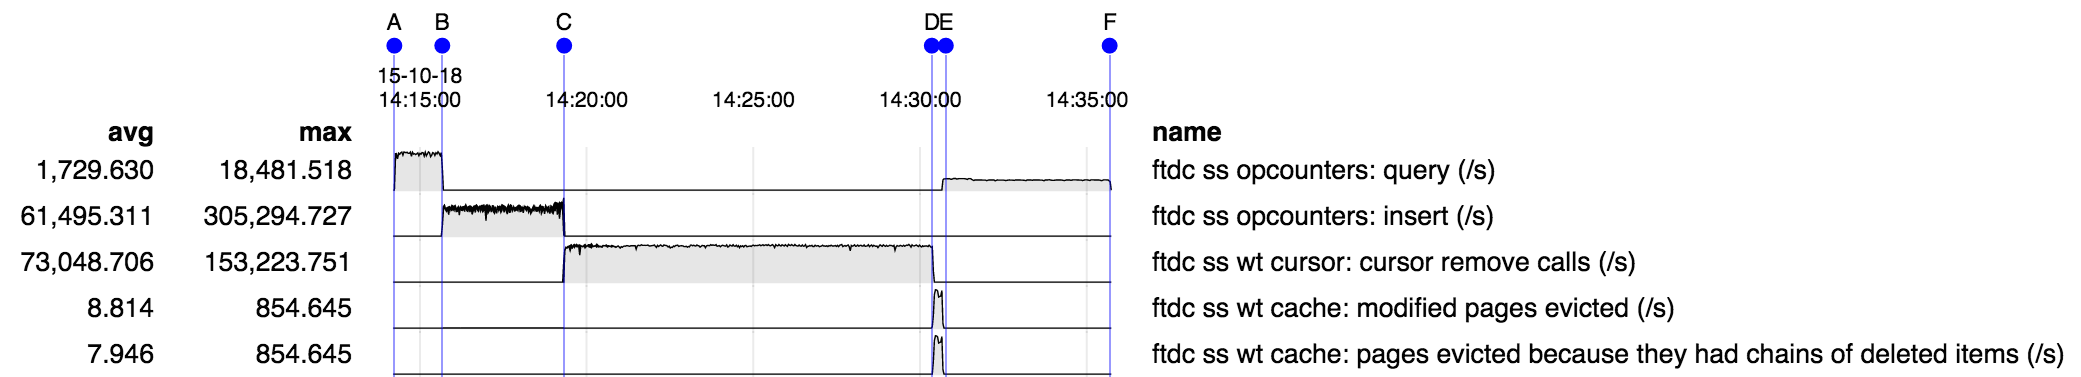
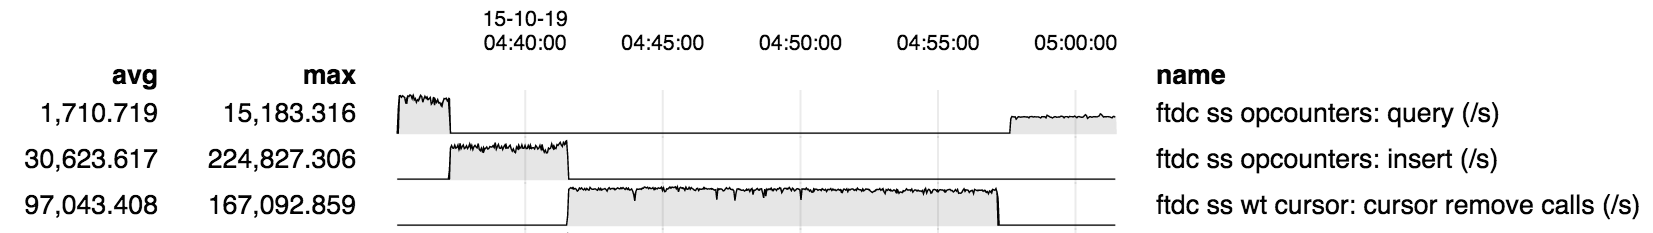
Here's an overview of the run for the shard that became stuck:

- inserts are fast but unbalanced because only one shard at a time is active in this particular test (due to simple shard key).
- insert rate drops very dramatically when ttl deletions begin at A. This performance hit seems suprisingly large.
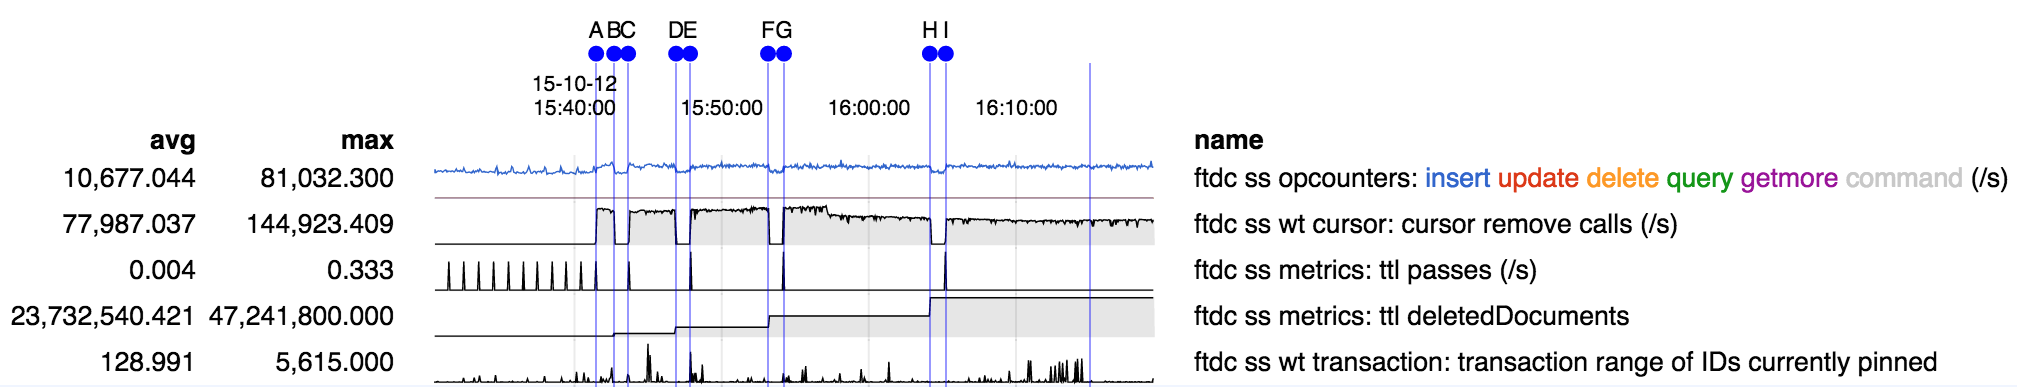
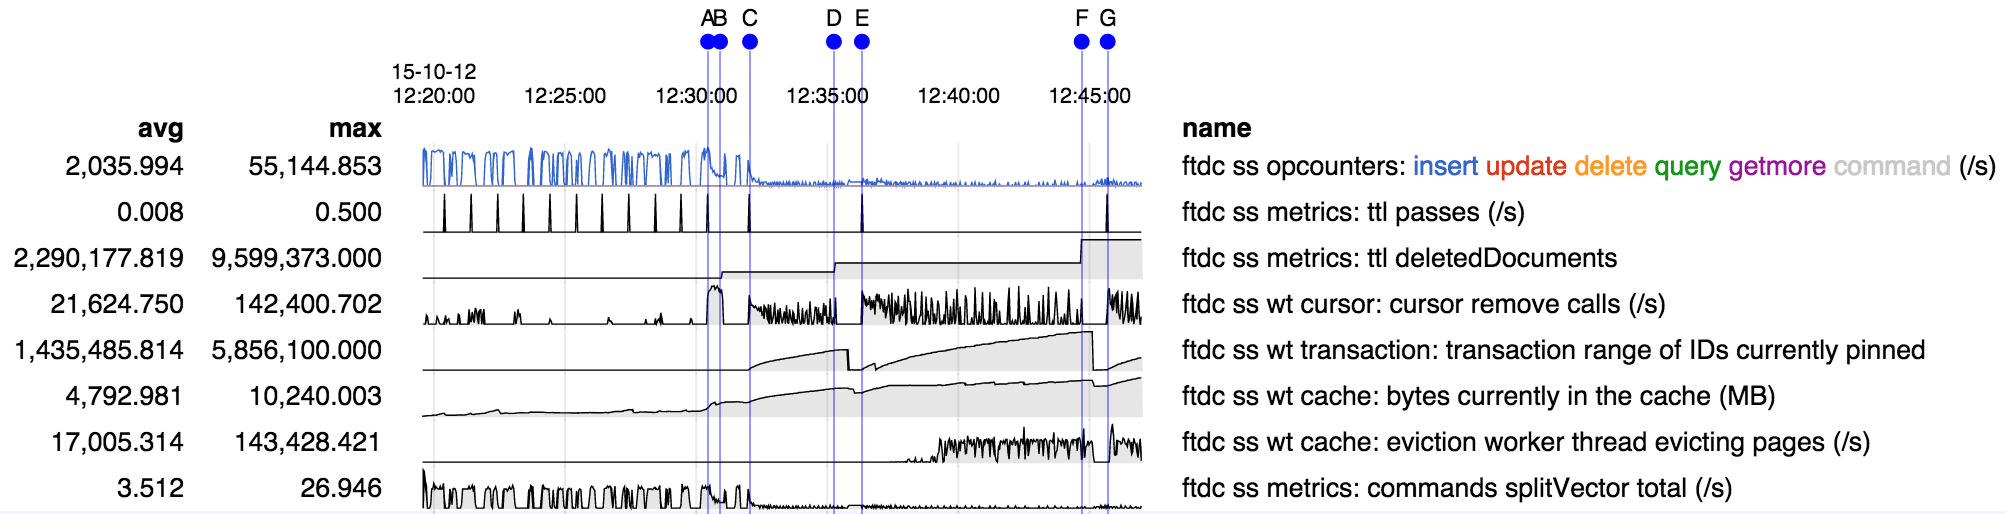
- ttl deletion passes run A-B, C-D, E-F, G-. Each begins with a bump in "ttl passes" and end with a bump in "ttl deletedDocuments"
- WT range of IDs pinned correlates well with the deletion passes. However I don't believe there are intentional long-running transactions, but rather I suspect one or more deletions just run very slowly.
- it appears that at H the cache becomes full and everything gets stuck, presumably because there are no evictions happening as per the stack traces above which were captured after H.
- interestingly though evictions appear to have been happening as normal right up to H - so why would they stop?
- there is no data after H because serverStatus has become stuck as well.
- the only clear connection to any sharding-related activity that I can find is the stuck splitVector call; however it has been running frequently and seems to be stuck in the same way serverStatus is, so it seems unlikely it is a culprit.
- is related to
-
-

- Closed
-
-
-
- Closed
-
- related to
-
-
- Closed
-