-
Type:
Bug
-
Resolution: Duplicate
-
Priority:
 Major - P3
-
None
-
Affects Version/s: 3.0.9
-
Component/s: WiredTiger
-
None
-
Environment:Distributor ID: Ubuntu
Description: Ubuntu 14.04.4 LTS
Release: 14.04
Codename: trusty
mongod -version
db version v3.0.9
git version: 20d60d3491908f1ae252fe452300de3978a040c7
AWS c4.4xlarge
1 x 6TB gp2 volume for mongo exclusively
No other significant processes or services running/consuming resource.Distributor ID: Ubuntu Description: Ubuntu 14.04.4 LTS Release: 14.04 Codename: trusty mongod -version db version v3.0.9 git version: 20d60d3491908f1ae252fe452300de3978a040c7 AWS c4.4xlarge 1 x 6TB gp2 volume for mongo exclusively No other significant processes or services running/consuming resource.
-
Linux
-
None
-
None
-
None
-
None
-
None
-
None
-
None
Apologies this may be a WT ticket?
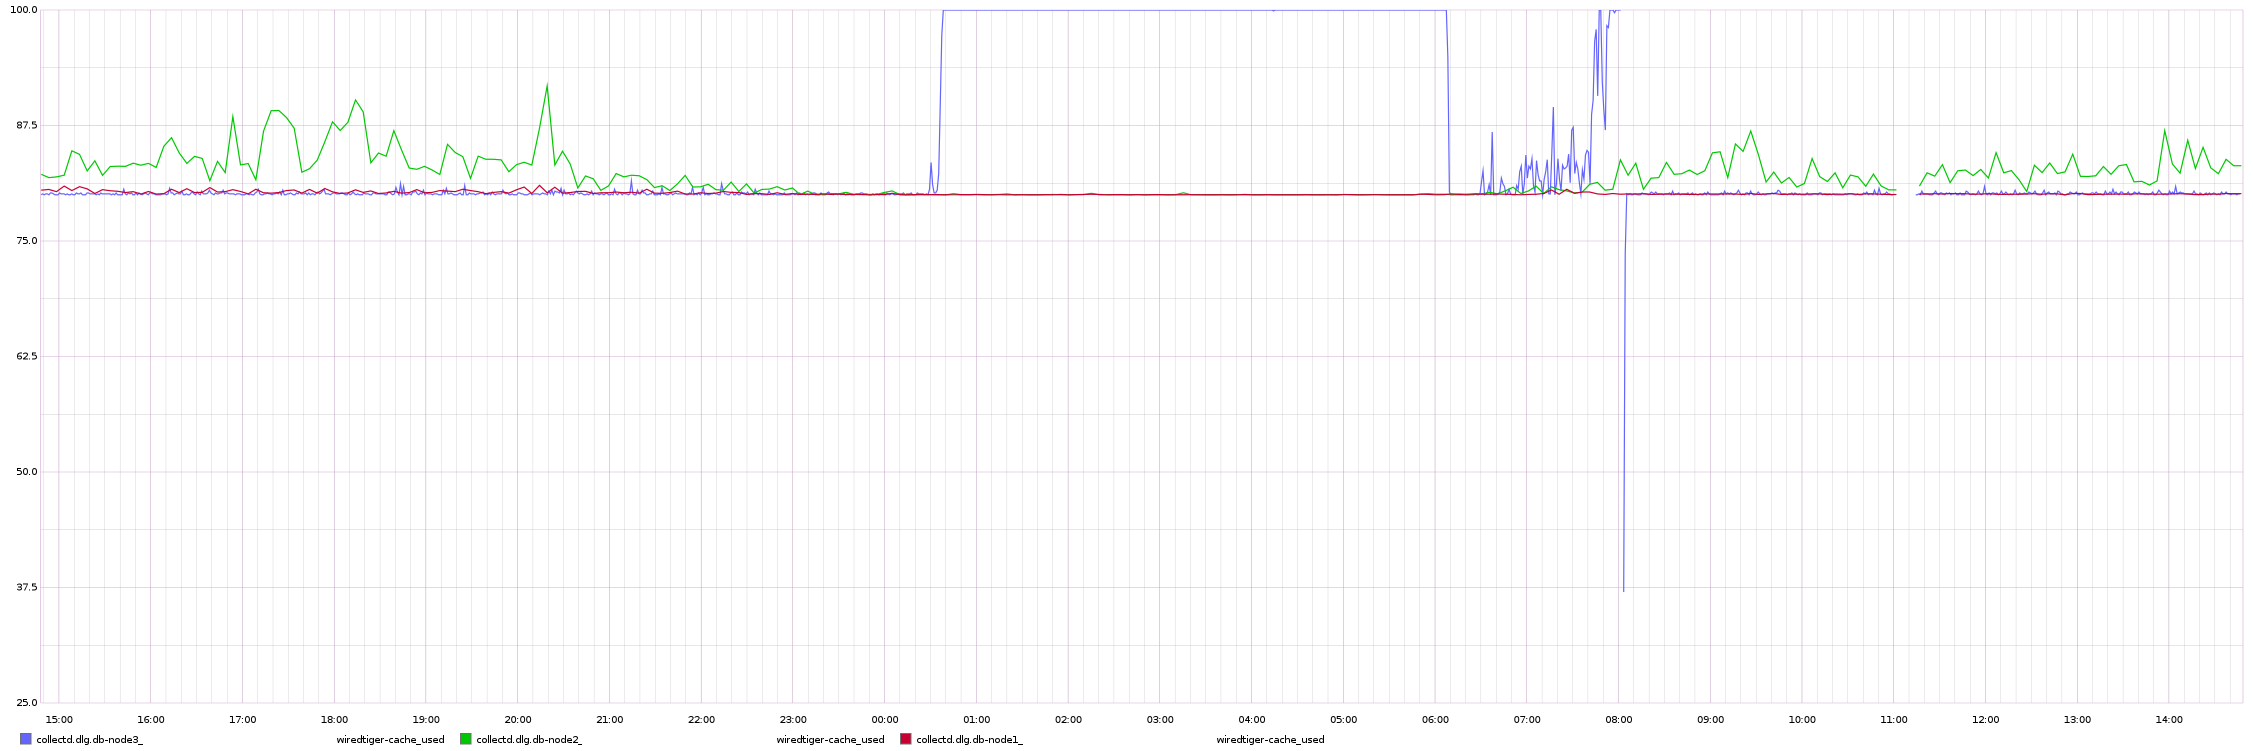
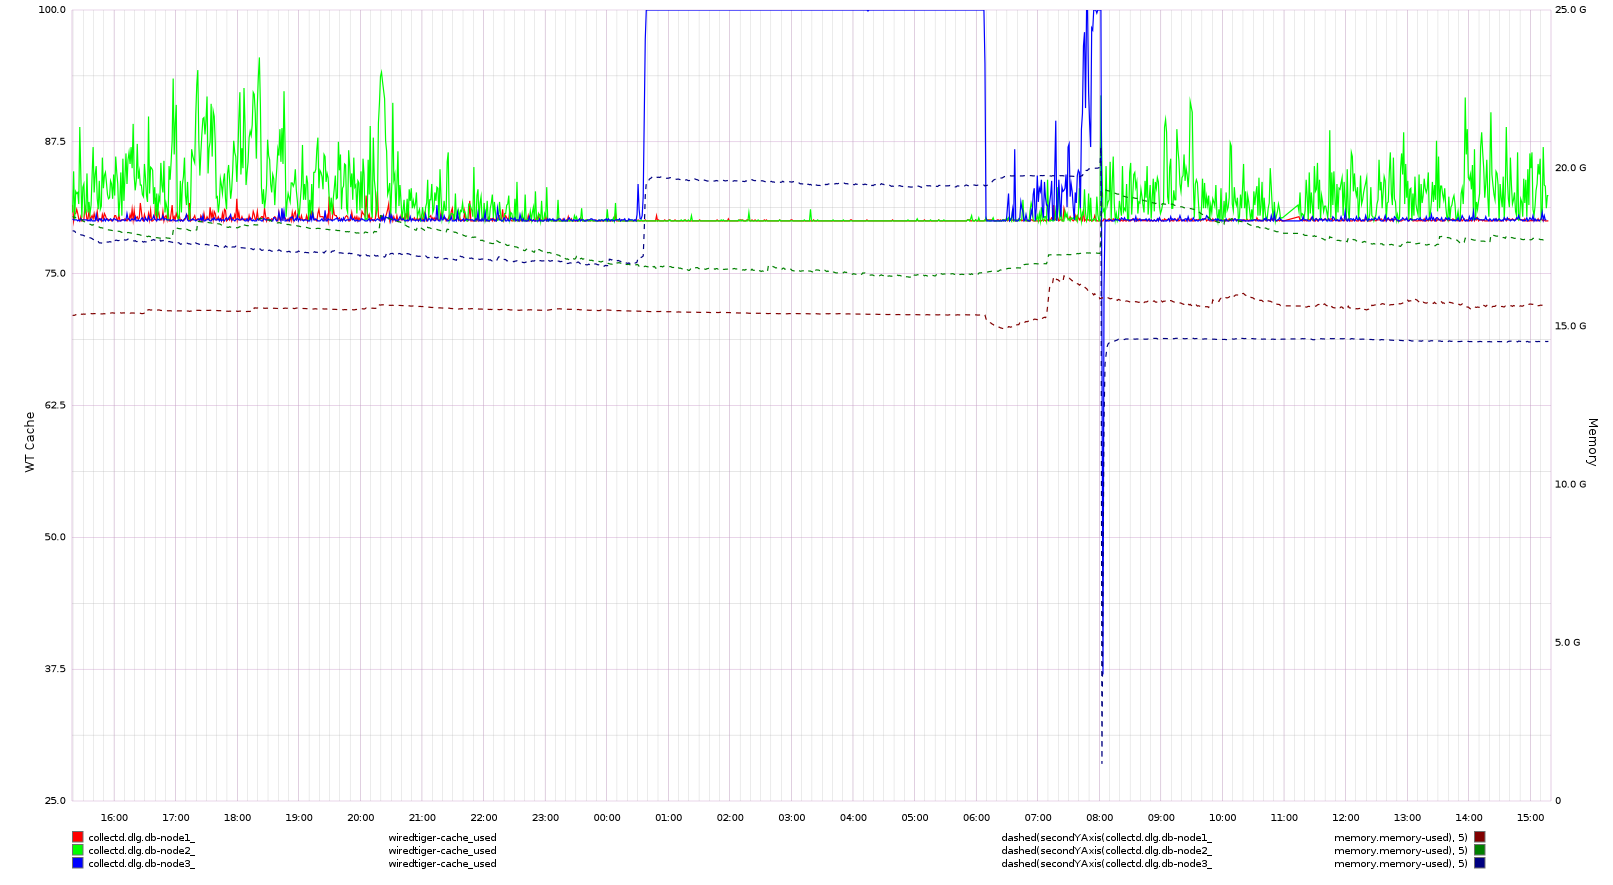
When running WiredTiger in a 3 node replica set, after a period of time one or more of the nodes will consistently run above 80% cache used and grow until it hits 100% at which point it will struggle to serve reads (or writes when master) in a timely fashion.
Usually a restart and or stepDown helps.
So far adding more eviction threads or reducing the eviction trigger and target does not help, nor does providing more RAM/cache.
Before this happens mongo uses ~45-50% ram, once the issue presents ram goes over 50% - anecdotally sometimes up to 80%.
The issue seems to occur randomly after days or more of apparent stability.
There is no apparent stress on the VM. More RAM did not help, more CPU seems to have reduced the rate of ocurrances (was on an m4.2xlarge). Before running on the current instances there was a lot of system CPU.
Running on 3 x AWS c4.4xlarge, 16 Cores, 60 GB Ram.
Mongostat output from the affected slave (during the issue):
insert query update delete getmore command % dirty % used flushes vsize   res qr|qw ar|aw netIn netOut conn   set repl     time
   *50   446  *1720     *3       4   274|0     0.3  100.0       0 17.4G 15.8G   0|0  1|16   85k     5m  681 floow  SEC 09:13:32
   *52   323  *3099    *91       1   113|0     0.5  100.0       0 17.4G 15.8G   0|3  27|0   60k     7m  681 floow  SEC 09:13:33
   *50   220  *2825     *6       4    75|0     0.2   99.7       0 17.4G 15.8G   0|0   1|2   43k     8m  681 floow  SEC 09:13:34
   *35   221  *3417    *11       2   263|0     0.3  100.0       0 17.4G 15.8G   0|2  1|12   54k     2m  681 floow  SEC 09:13:35
   *18   432  *2013    *12       8   344|0     0.2  100.0       0 17.4G 15.8G   2|3  19|0   92k    16m  681 floow  SEC 09:13:36
IOStat:
03/08/2016 09:14:09 AM
avg-cpu:  %user   %nice %system %iowait  %steal   %idle
          13.17    0.00    4.62    2.70    0.13   79.38

Device:         rrqm/s   wrqm/s     r/s     w/s    rkB/s    wkB/s avgrq-sz avgqu-sz   await r_await w_await  svctm  %util
xvda              0.00     0.00    0.00    0.00     0.00     0.00     0.00     0.00    0.00    0.00    0.00   0.00   0.00
xvdz              0.00     0.00    0.00    0.00     0.00     0.00     0.00     0.00    0.00    0.00    0.00   0.00   0.00
xvdb              0.00     0.00 1455.00    0.00 16260.00     0.00    22.35     1.06    0.74    0.74    0.00   0.16  22.80
iotop:
Total DISK READ :      13.69 M/s | Total DISK WRITE :      41.78 M/s
Actual DISK READ:      13.72 M/s | Actual DISK WRITE:      23.58 M/s
   TID  PRIO  USER     DISK READ  DISK WRITE  SWAPIN     IO>    COMMAND
 72806 be/4 mongodb     3.83 K/s    8.72 M/s  0.00 % 54.51 % mongod --config /etc/mongod.conf
   686 be/3 root        0.00 B/s  881.69 K/s  0.00 % 14.18 % [jbd2/xvdb-8]
129706 be/4 mongodb  1153.86 K/s   46.00 K/s  0.00 %  7.27 % mongod --config /etc/mongod.conf
- duplicates
-
-
- Closed
-
-
SERVER-24580 Improve performance when WiredTiger cache is full
-

- Closed
-