-
Type:
Bug
-
Resolution: Fixed
-
Priority:
 Major - P3
-
Affects Version/s: 3.6.0-rc4
-
Component/s: Networking, Stability
-
None
-
Fully Compatible
-
ALL
-
v3.6
-
-
Platforms 2017-12-18, Platforms 2018-01-01, Platforms 2018-01-15
-
0
-
None
-
None
-
None
-
None
-
None
-
None
-
None
Reproduced on version r3.6.0-rc4-41-ge608b8b349
On a three-node replica set, I generated traffic via the load.java attached. (Note the original load.java comes from from SERVER-30613 - https://jira.mongodb.org/secure/attachment/163112/load.java. I've modified the script to set a write concern of 3).
$ java -cp load:mongo-java-driver/mongo-java-driver/build/libs/mongo-java-driver-3.5.0.jar load host=172.31.34.92 op=ramp_update docs=1000000 threads=500 tps=10 qps=1000 dur=150 size=100 updates=10
The above runs successfully with the default (synchronous) settings.
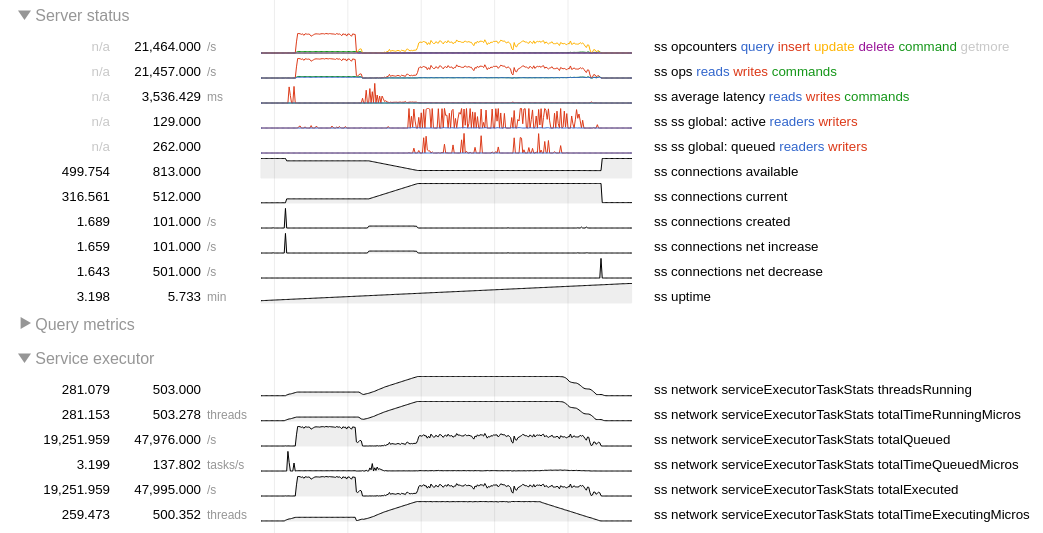
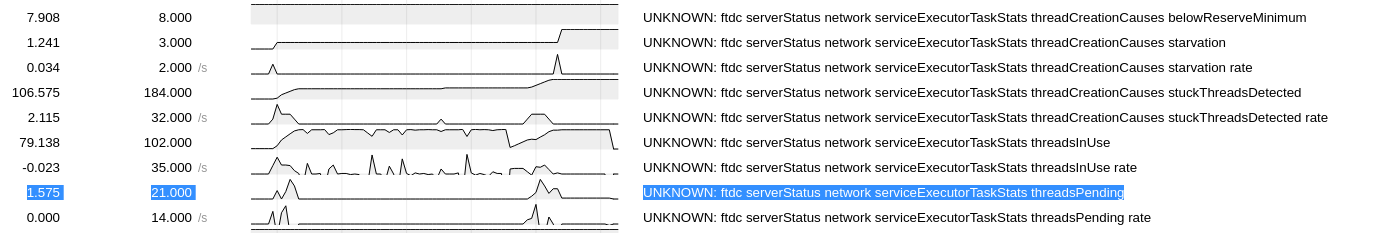
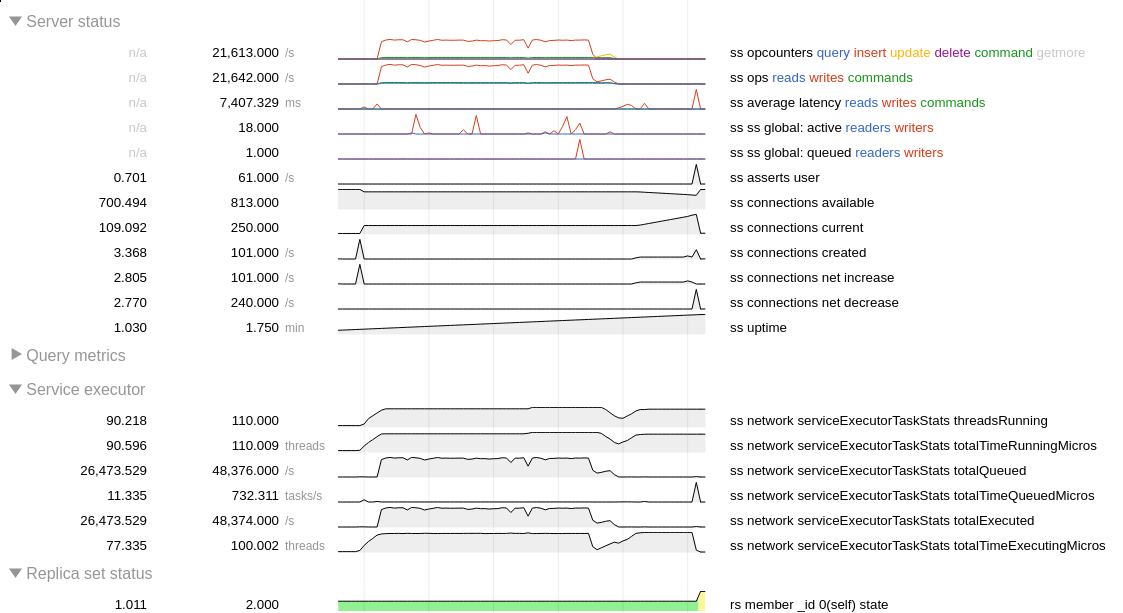
With asynchronous service executor enabled, the primary becomes unresponsive as the update workload ramps up. This results in the secondaries starting an election and the primary stepping down.
For the test I used four AWS EC2 m4.4xlarge, one per replica set member, the fourth one for the traffic generator.
The snapshot below shows that the update workload starts at A and then performance degrades as the number of connections increases.
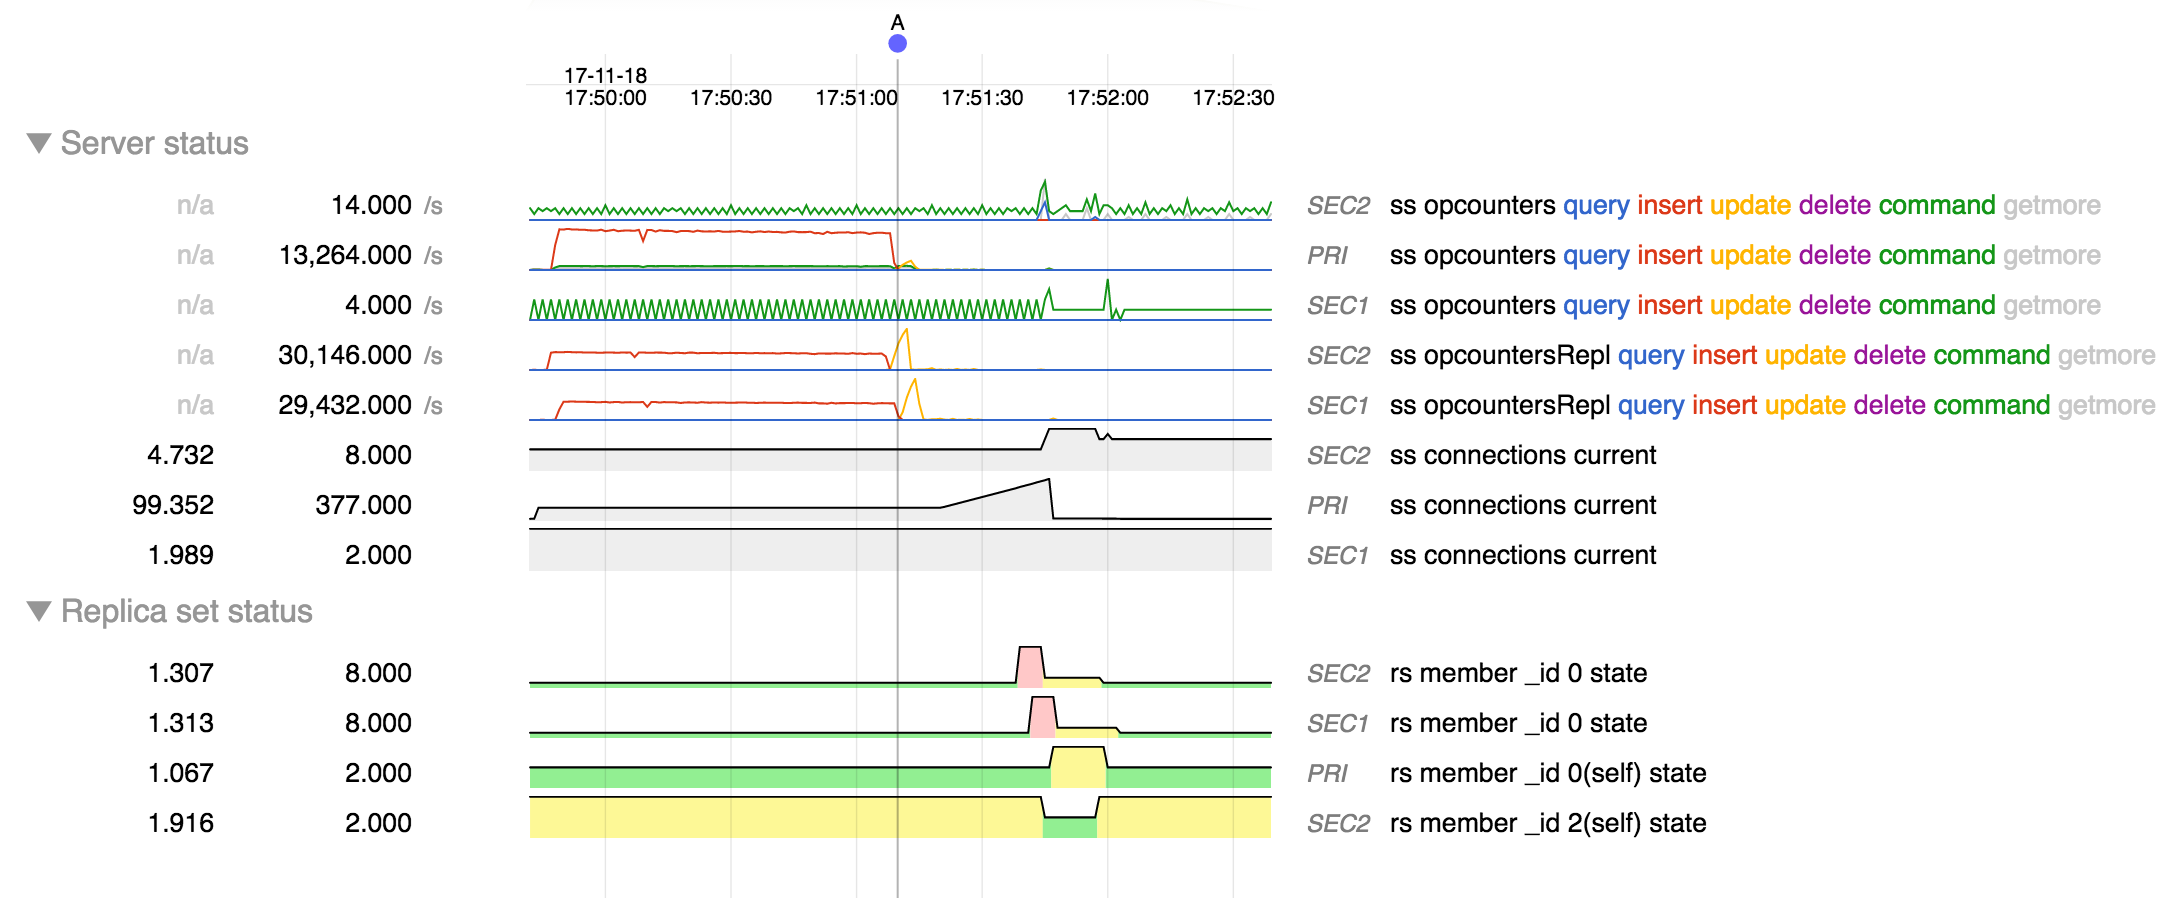
From log of the secondary that transitions to primary:
2017-11-18T17:51:39.122+0000 I ASIO     [NetworkInterfaceASIO-RS-0] Ending connection to host 172.31.34.92:27017 due to bad connection status; 1 connections to that host remain open
2017-11-18T17:51:39.122+0000 I REPL     [replication-1] Restarting oplog query due to error: ExceededTimeLimit: error in fetcher batch callback: Operation timed out. Last fetched optime (with hash): { ts:
 Timestamp(1511027488, 17), t: 1 }[1005646539139698744]. Restarts remaining: 3
2017-11-18T17:51:39.122+0000 I ASIO     [NetworkInterfaceASIO-RS-0] Connecting to 172.31.34.92:27017
2017-11-18T17:51:39.122+0000 I REPL     [replication-1] Scheduled new oplog query Fetcher source: 172.31.34.92:27017 database: local query: { find: "oplog.rs", filter: { ts: { $gte: Timestamp(1511027488,
17) } }, tailable: true, oplogReplay: true, awaitData: true, maxTimeMS: 60000, batchSize: 13981010, term: 1, readConcern: { afterClusterTime: Timestamp(1511027488, 17) } } query metadata: { $replData: 1,
$oplogQueryData: 1, $readPreference: { mode: "secondaryPreferred" } } active: 1 findNetworkTimeout: 65000ms getMoreNetworkTimeout: 10000ms shutting down?: 0 first: 1 firstCommandScheduler: RemoteCommandRe
tryScheduler request: RemoteCommand 160994 -- target:172.31.34.92:27017 db:local cmd:{ find: "oplog.rs", filter: { ts: { $gte: Timestamp(1511027488, 17) } }, tailable: true, oplogReplay: true, awaitData:
true, maxTimeMS: 60000, batchSize: 13981010, term: 1, readConcern: { afterClusterTime: Timestamp(1511027488, 17) } } active: 1 callbackHandle.valid: 1 callbackHandle.cancelled: 0 attempt: 1 retryPolicy: R
etryPolicyImpl maxAttempts: 1 maxTimeMillis: -1ms
2017-11-18T17:51:39.632+0000 I REPL     [replexec-0] Starting an election, since we've seen no PRIMARY in the past 10000ms
Attached logs, diagnostic data and application output.