Uploaded image for project: 'Core Server'
  1. Core Server
  2. SERVER-42698

WT Cache eviction server performance regression in 3.6.13 (compared to 3.4.16)

    • Type: Icon: Bug Bug
    • Resolution: Gone away
    • Priority: Icon: Major - P3 Major - P3
    • None
    • Affects Version/s: 3.6.13
    • Component/s: None
    • Labels:
      None
    • Fully Compatible
    • ALL

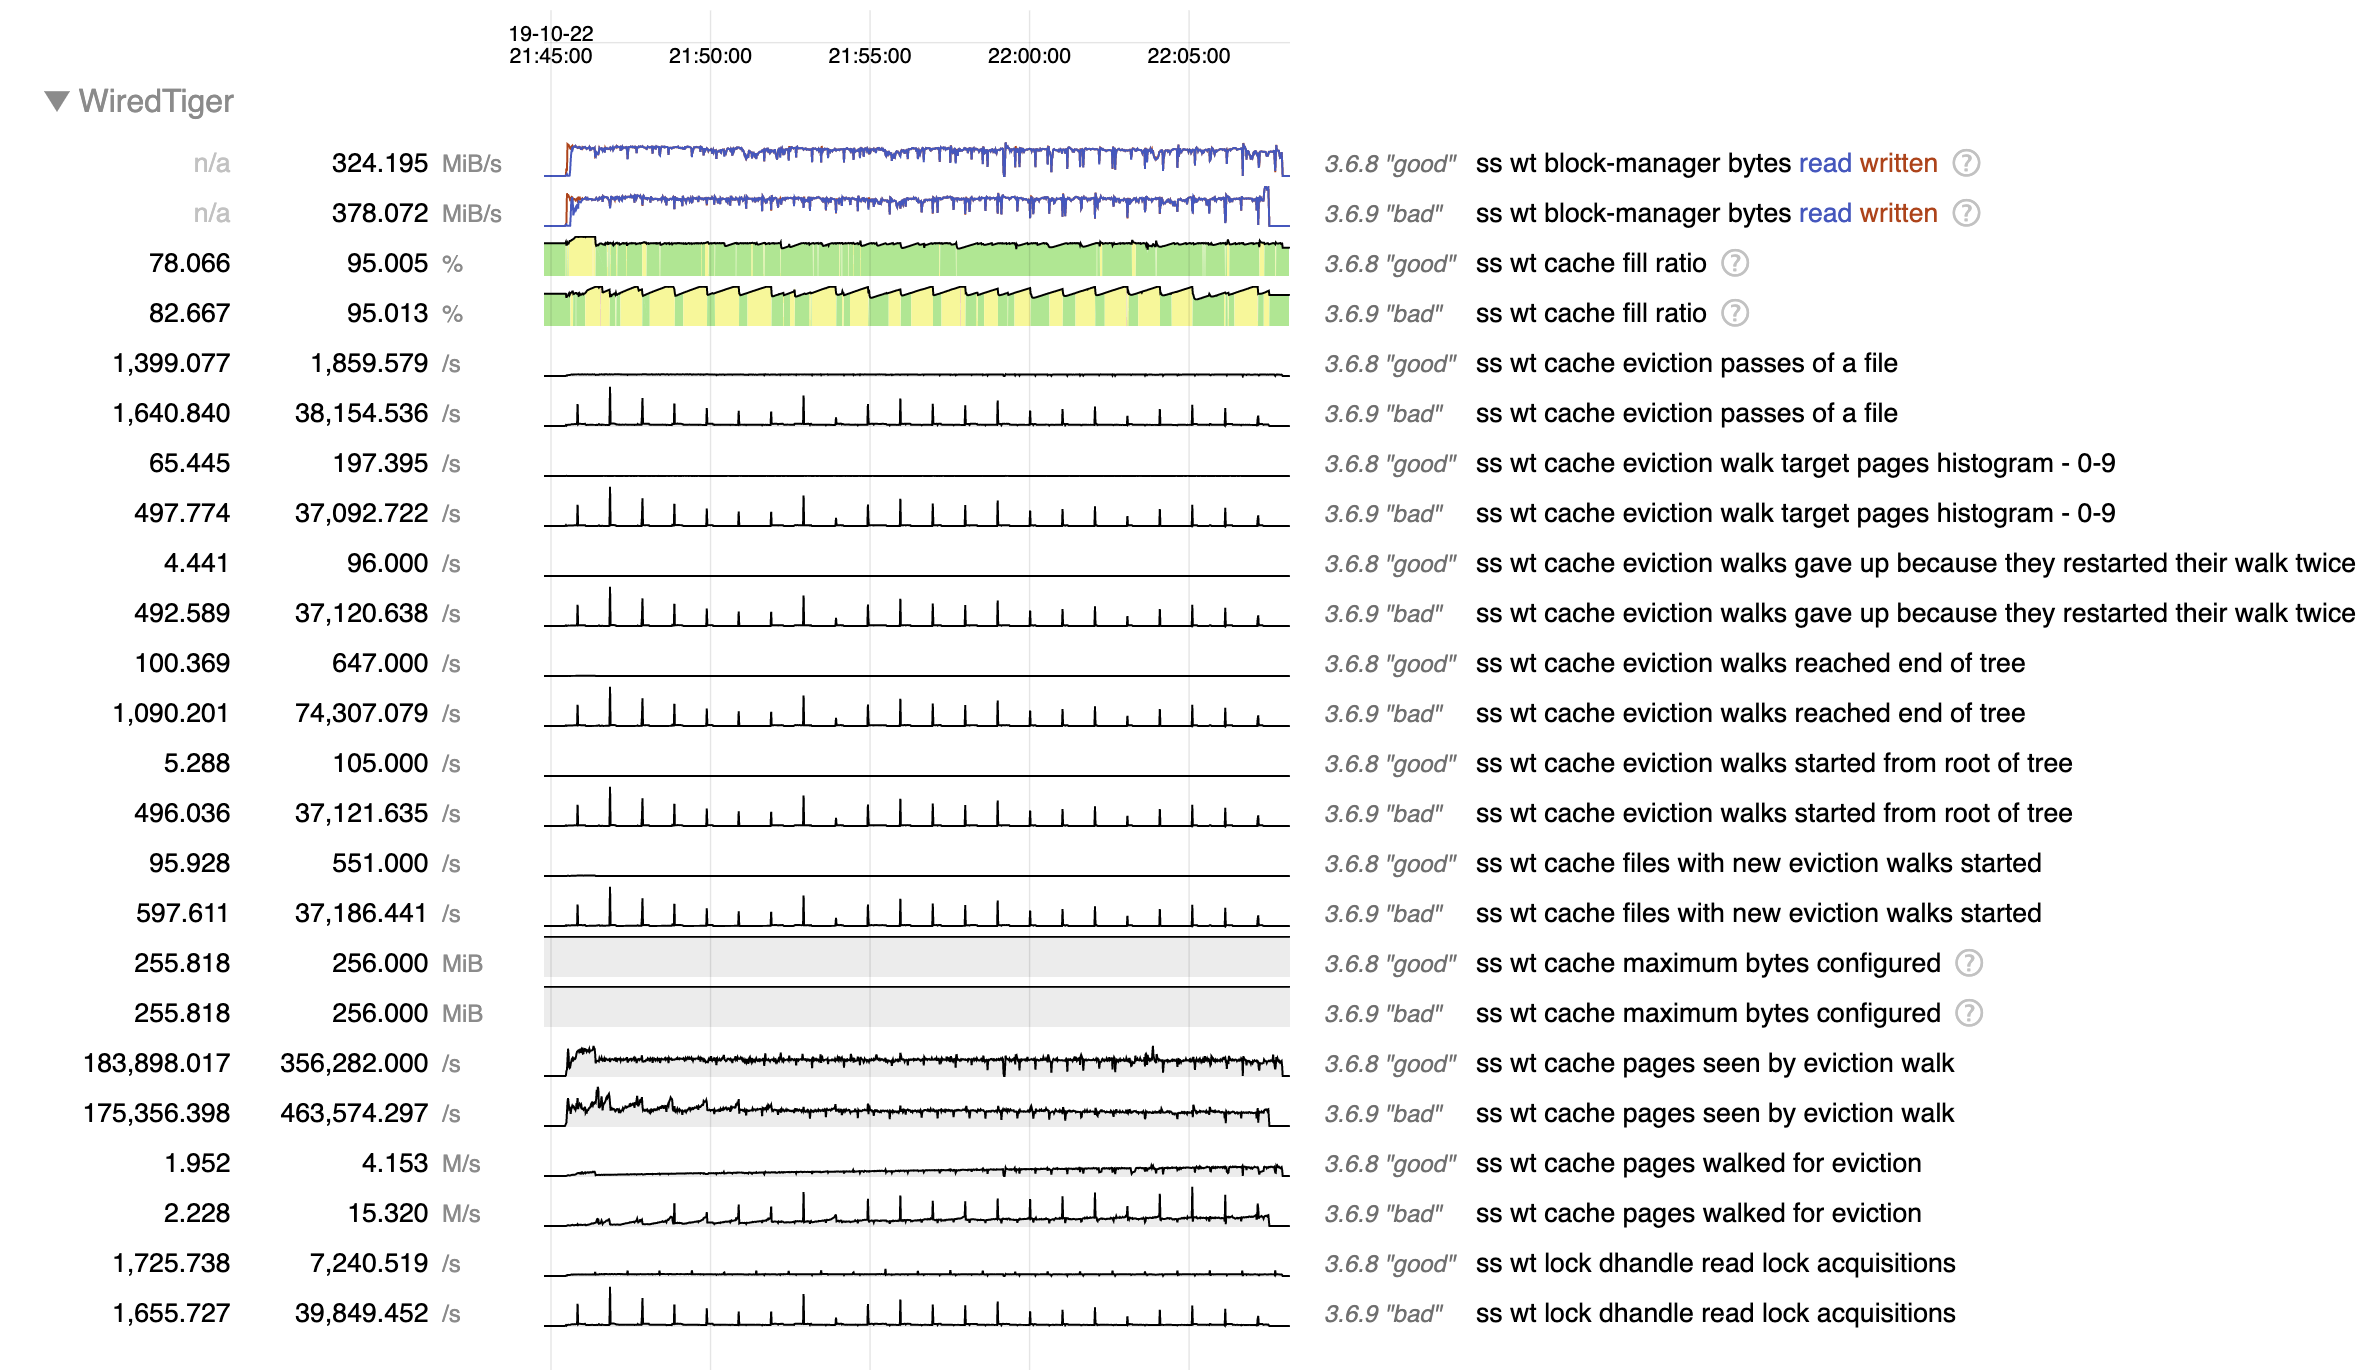
      While investigating SERVER-42256 we tried 3.6.13 as suggested (only secondary for now) and so far we noticed some memory leak (SERVER-42662) and some huge cache eviction server performance regression (we think).

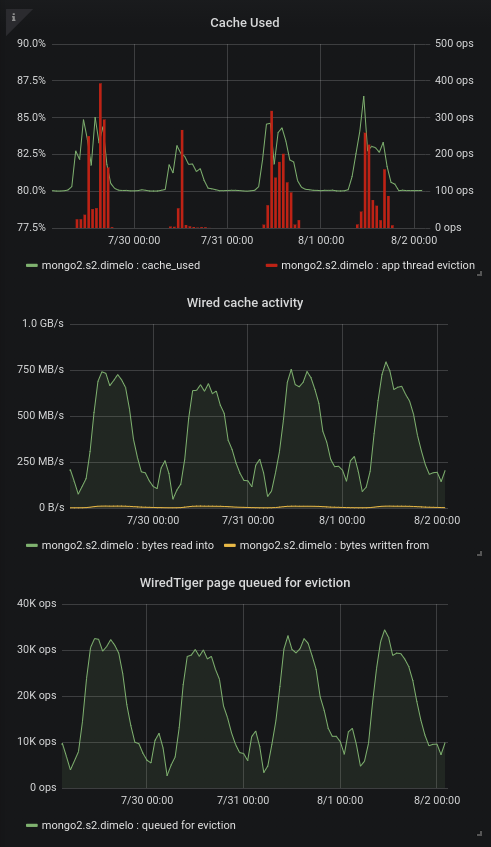
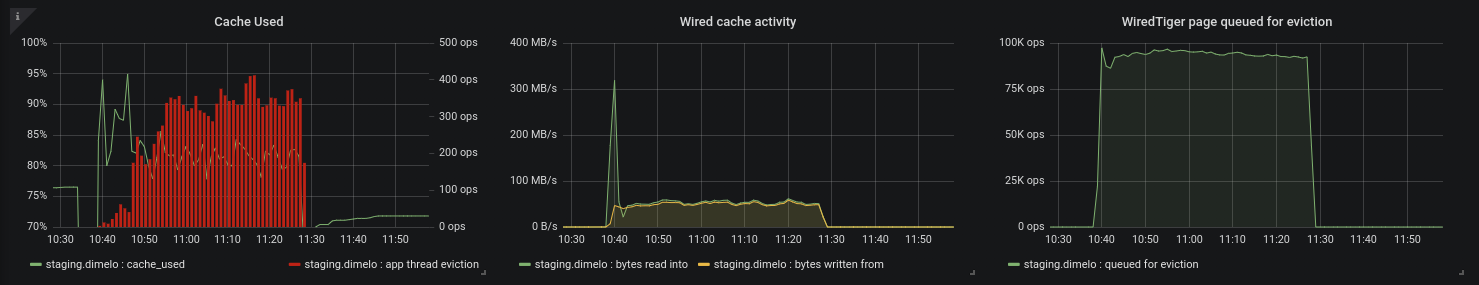
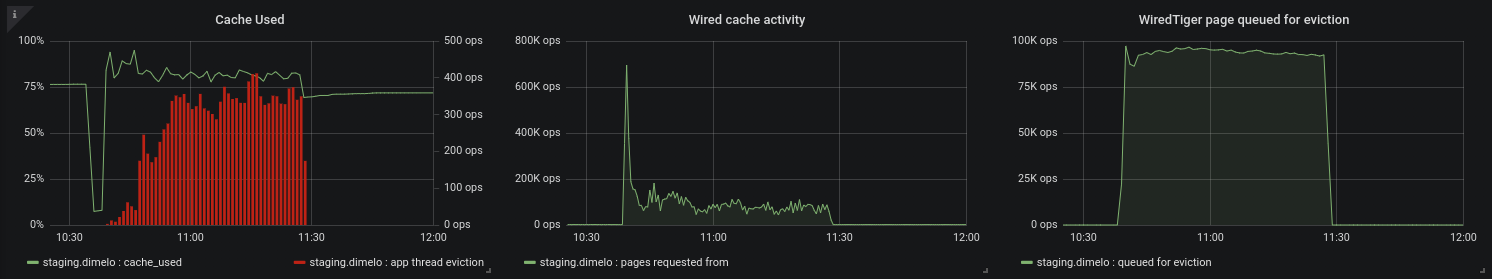
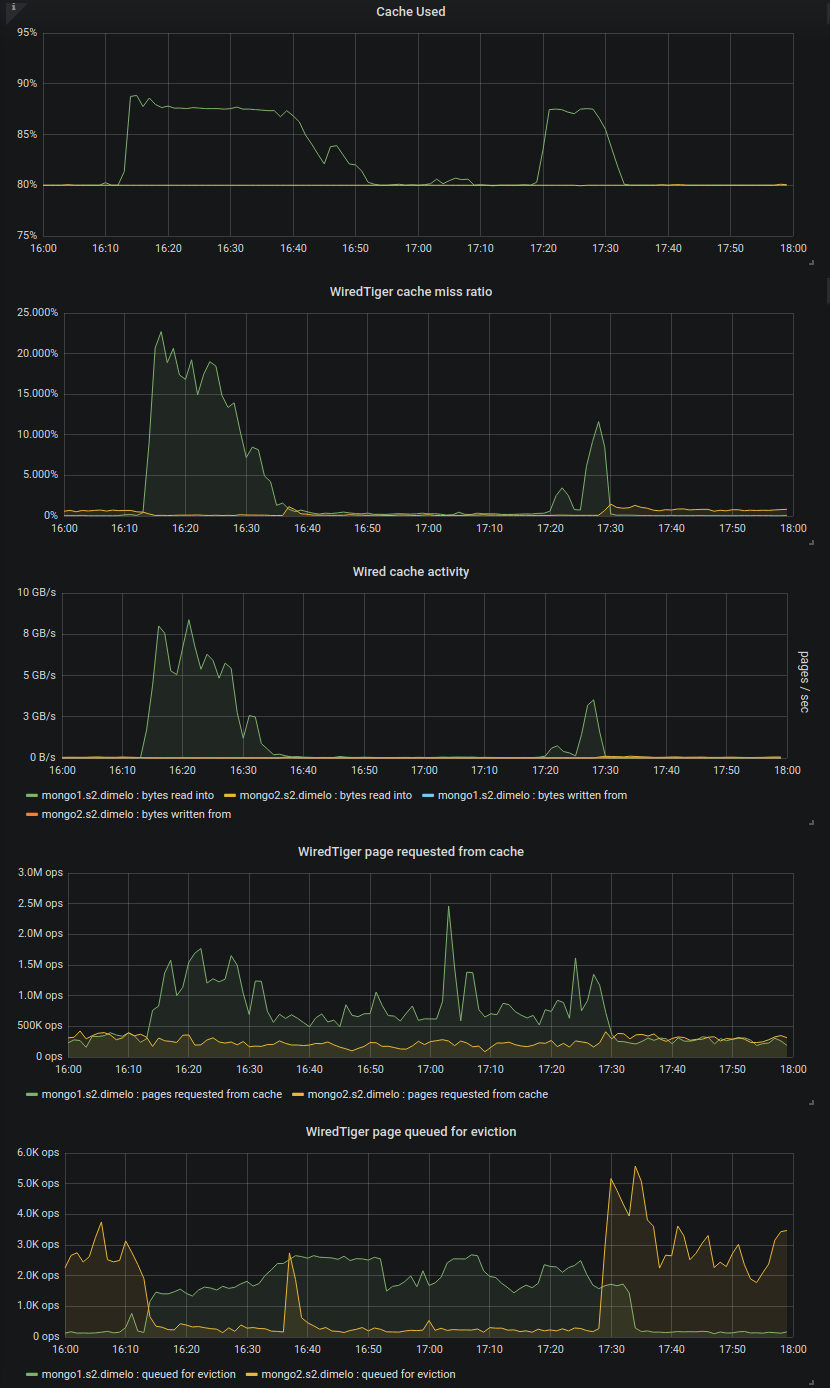
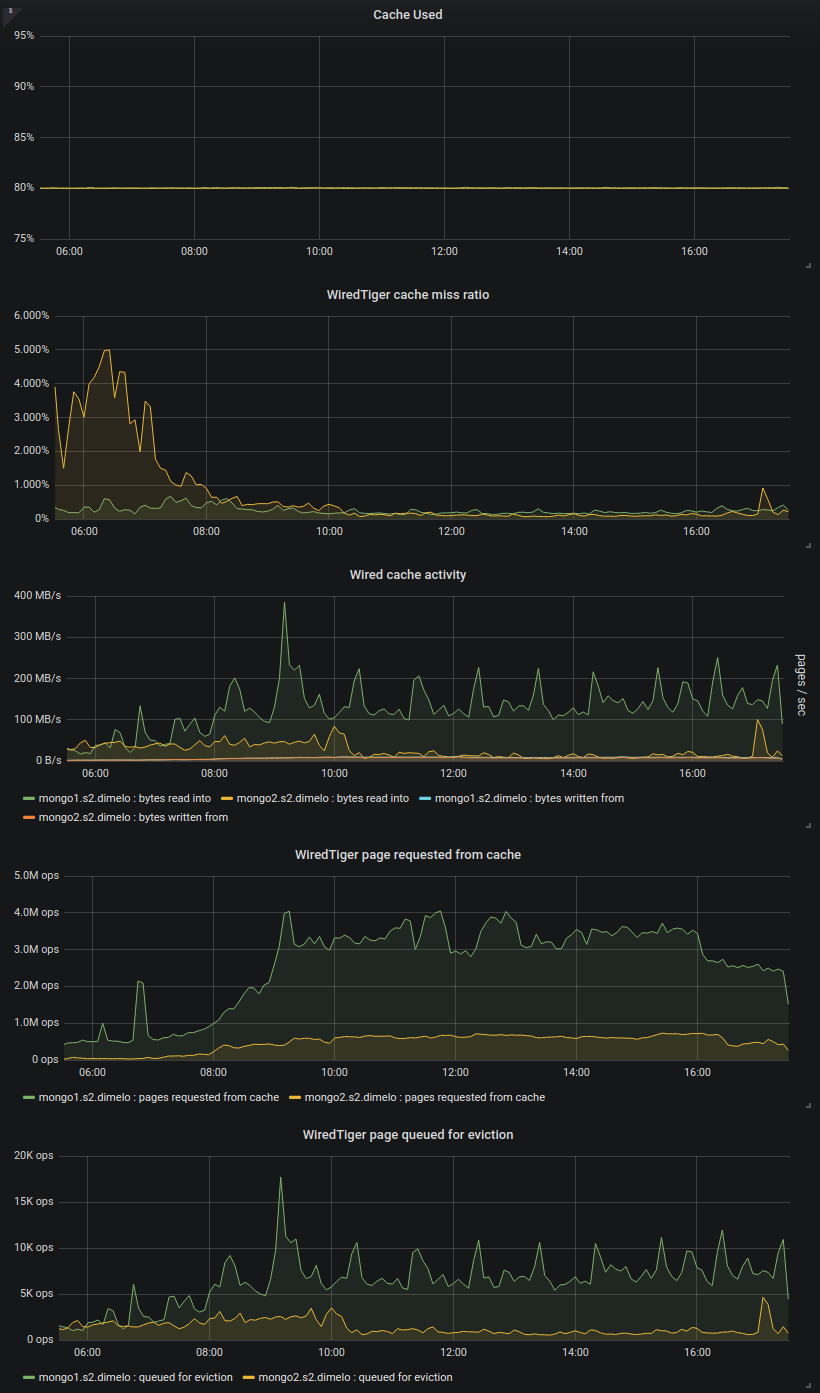
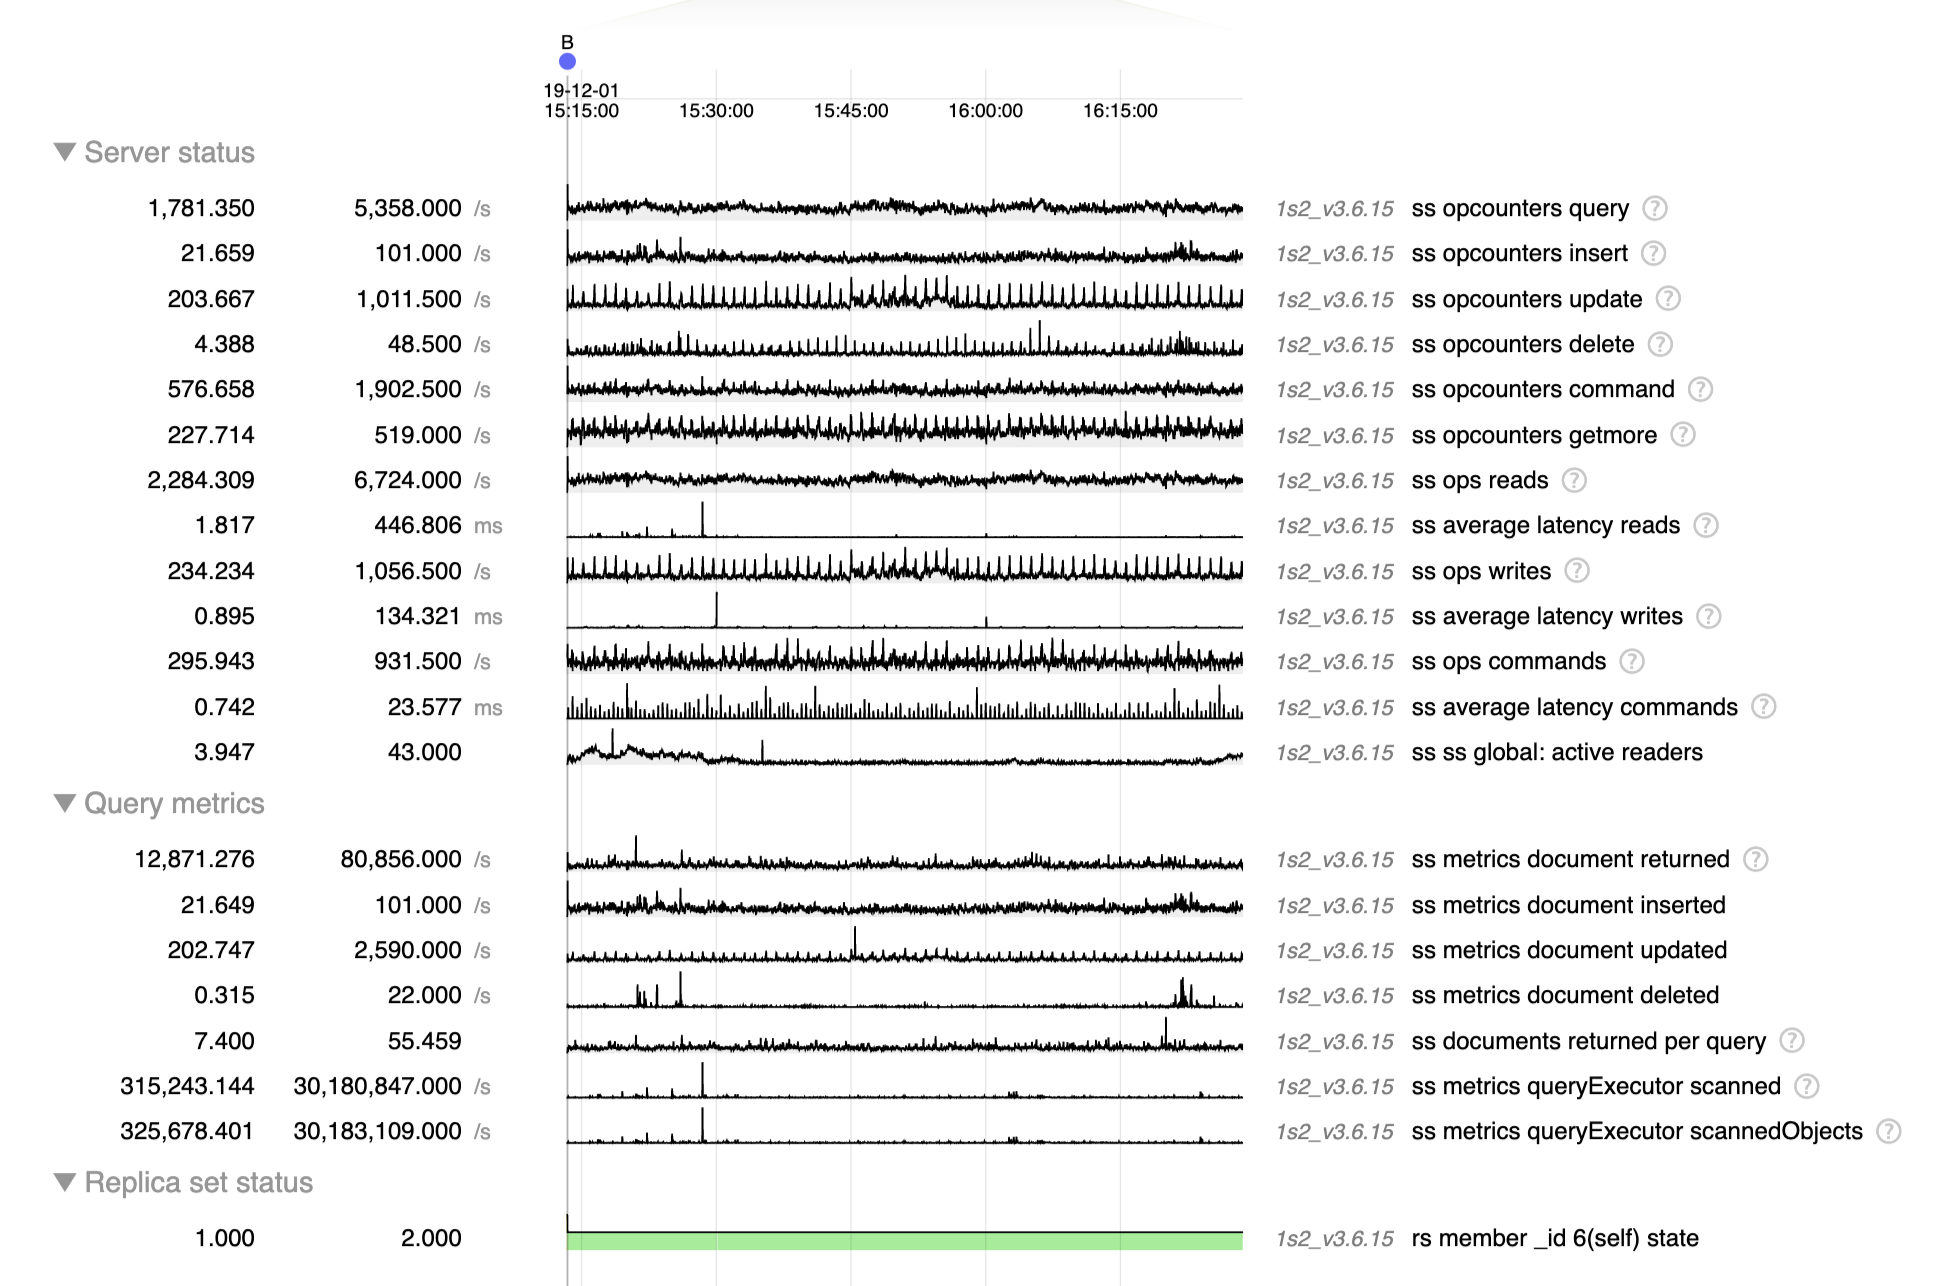
      We added some charts to our monitoring about this since we're hitting the limits of the eviction server (the single threaded one filling the queue apparently). On one of our primary in 3.4.13 we regularly hit 30k+ page queued for eviction per second, and at this point it's pretty much saturated and can't fill up the queue any more, increasing cache usage to 95% and generating app thread evictions (this is SERVER-42256):

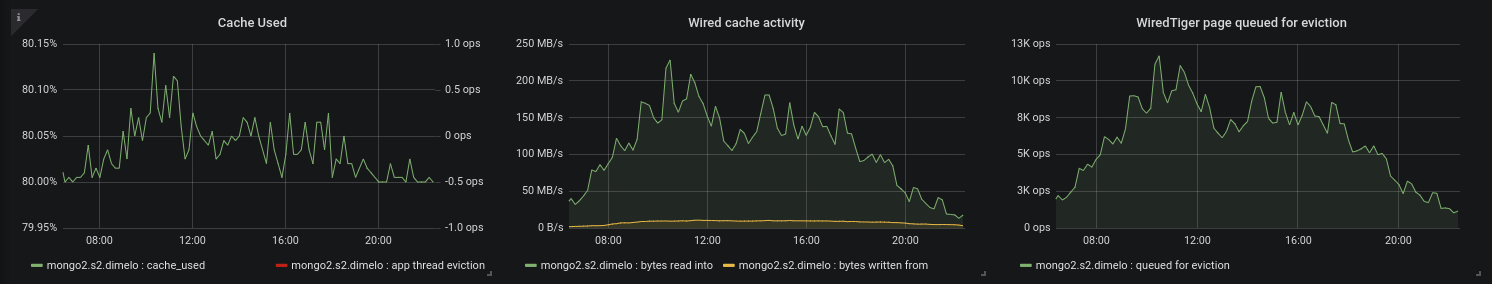
      So then we put a secondary on 3.6.13, nothing bad so far except that we already see some big cache used spikes with almost no traffic (only mongodump) as mentioned in https://jira.mongodb.org/browse/SERVER-42256?focusedCommentId=2354831&page=com.atlassian.jira.plugin.system.issuetabpanels%3Acomment-tabpanel#comment-2354831

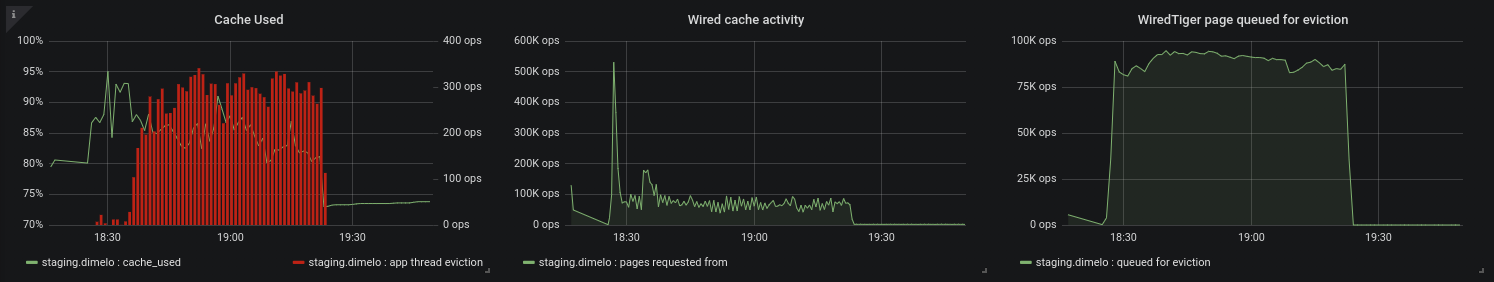
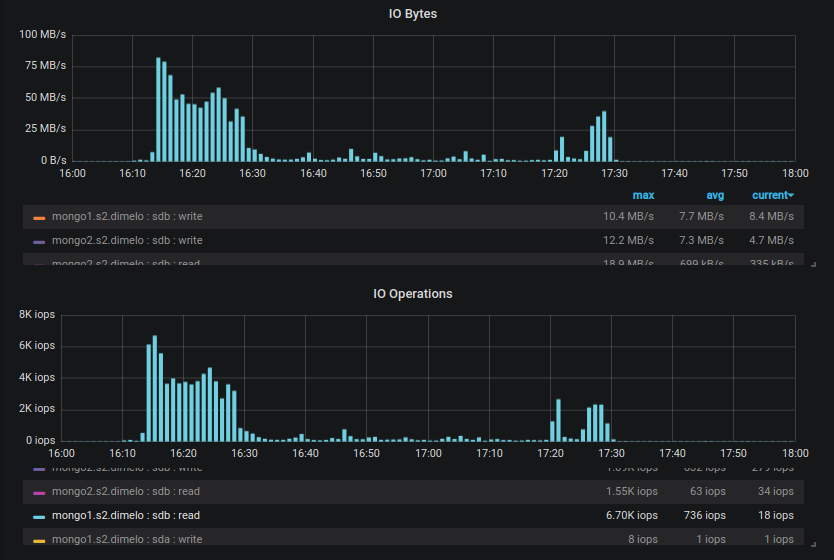
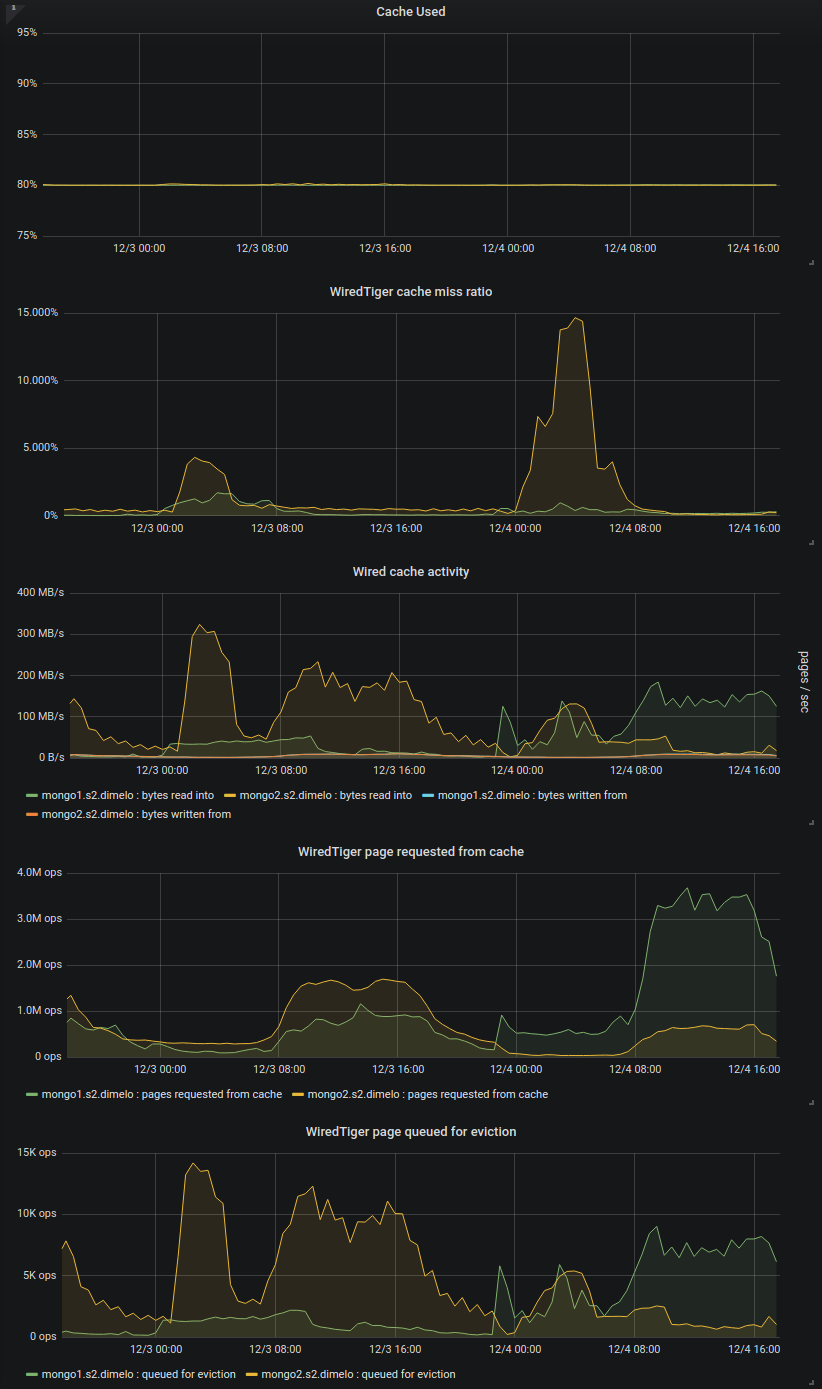
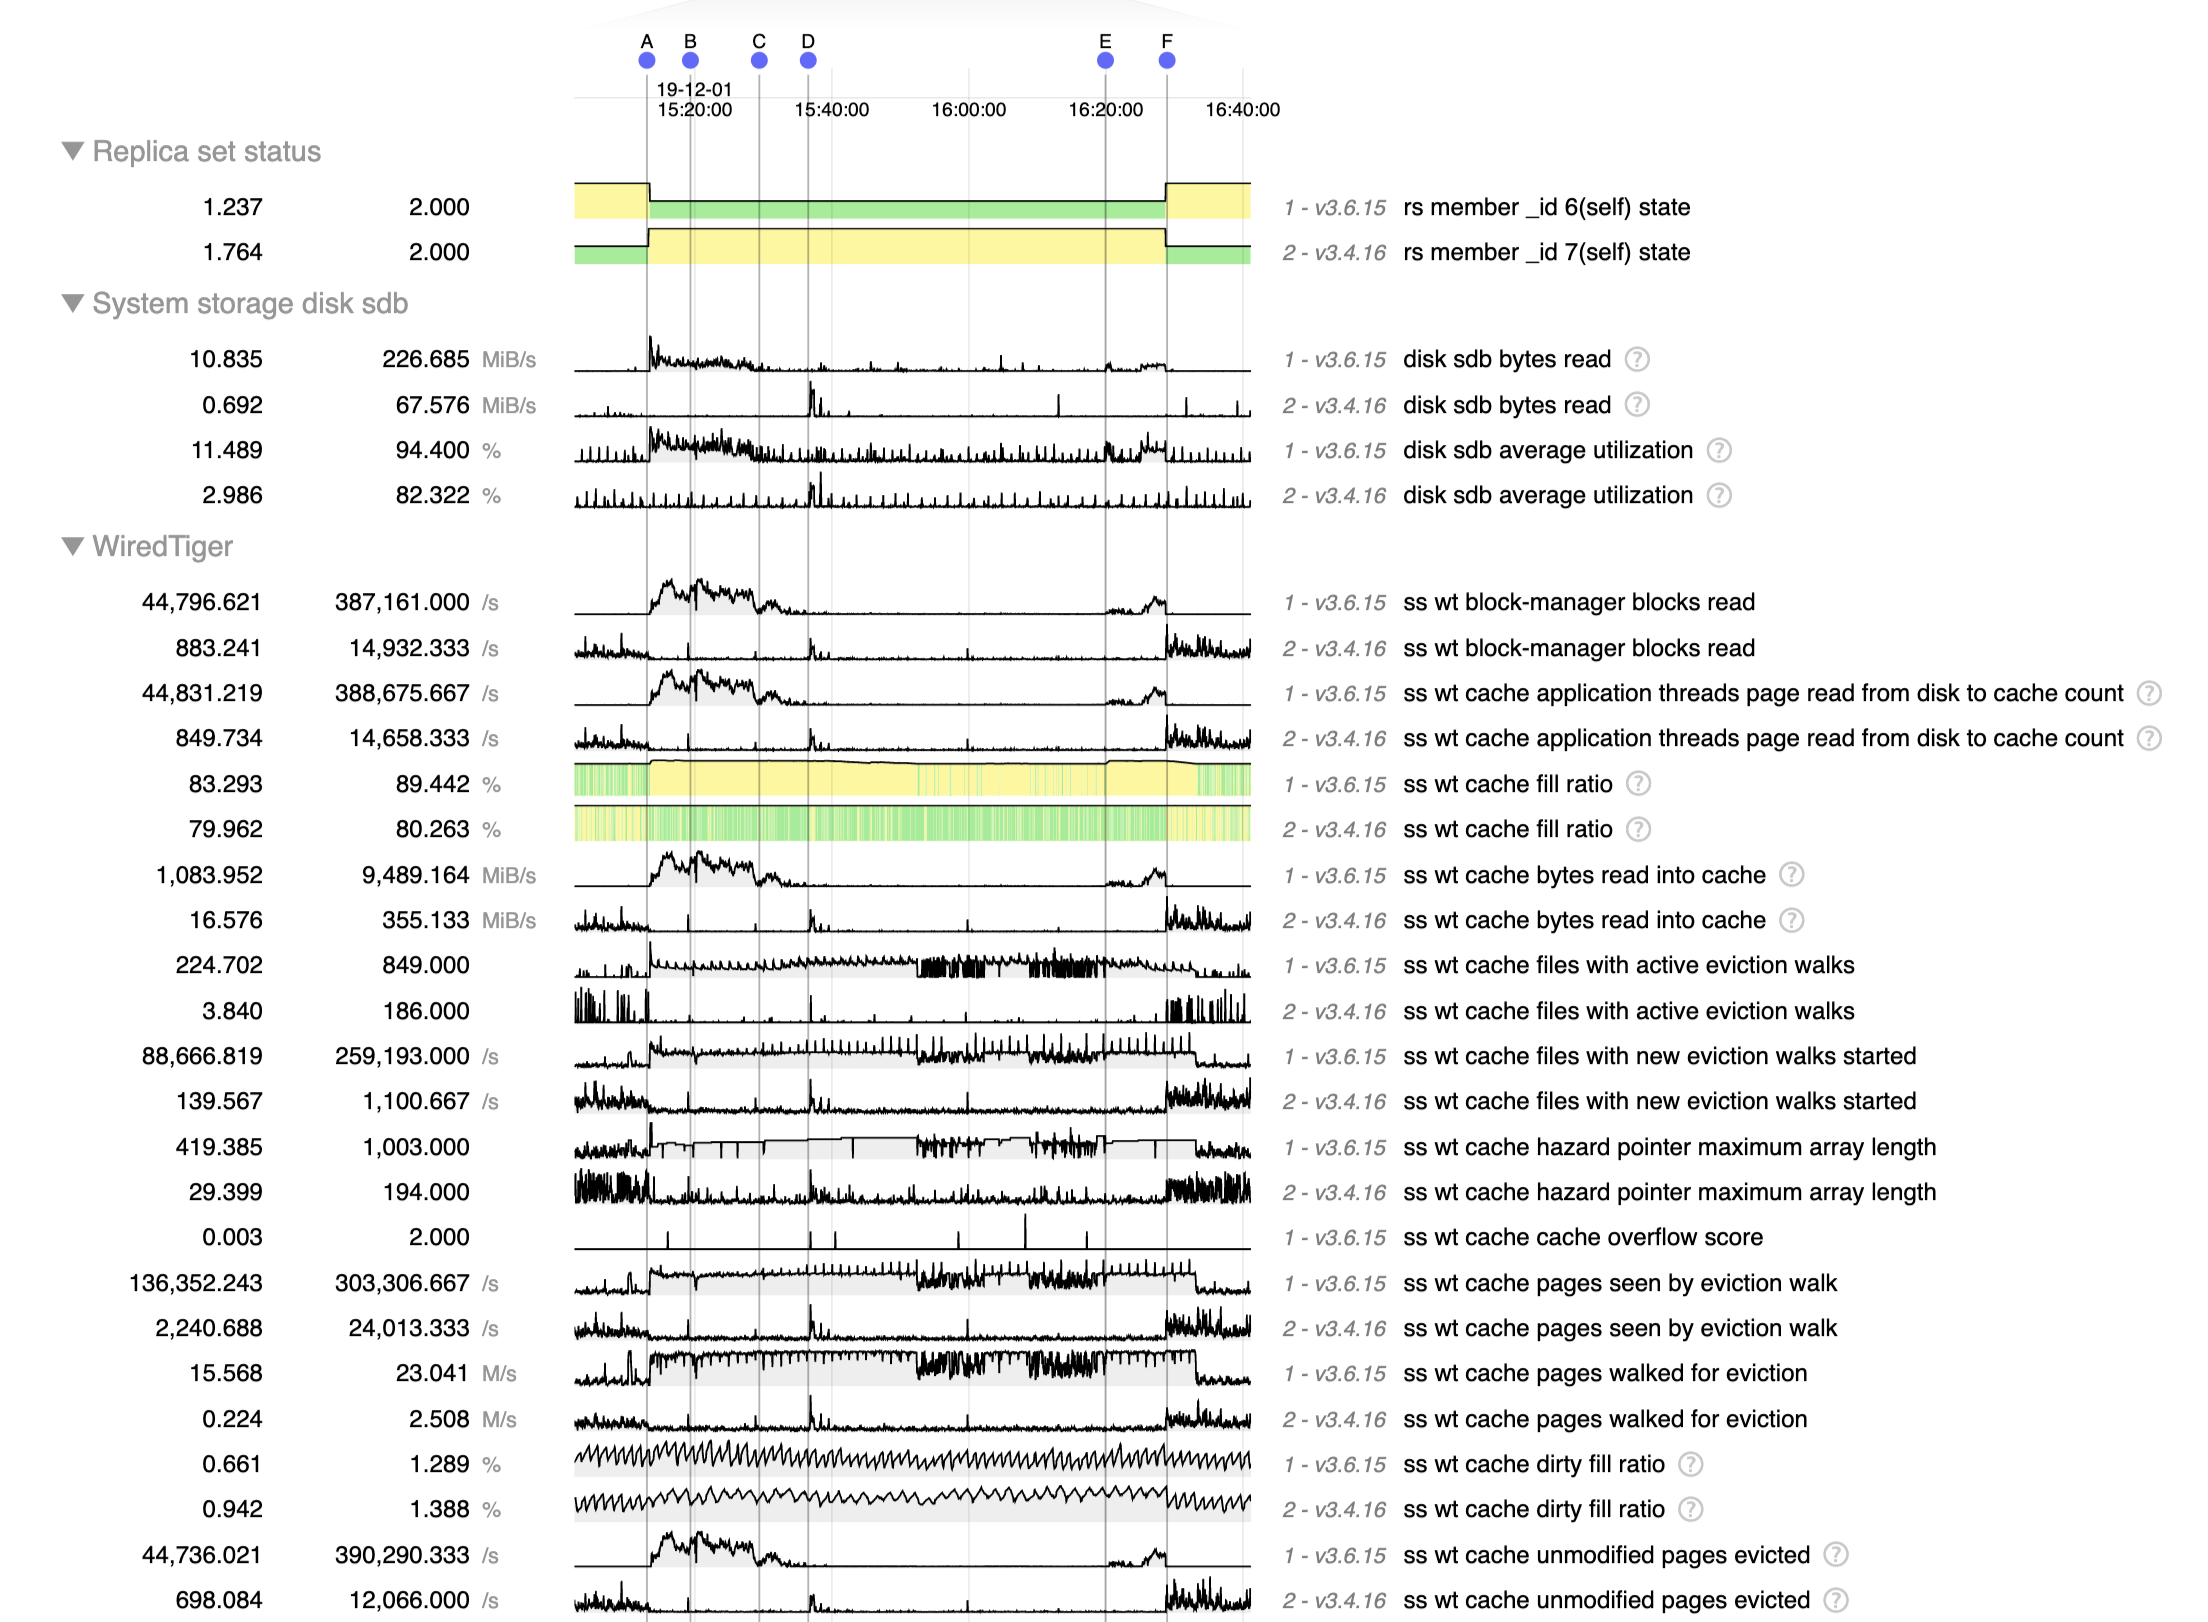
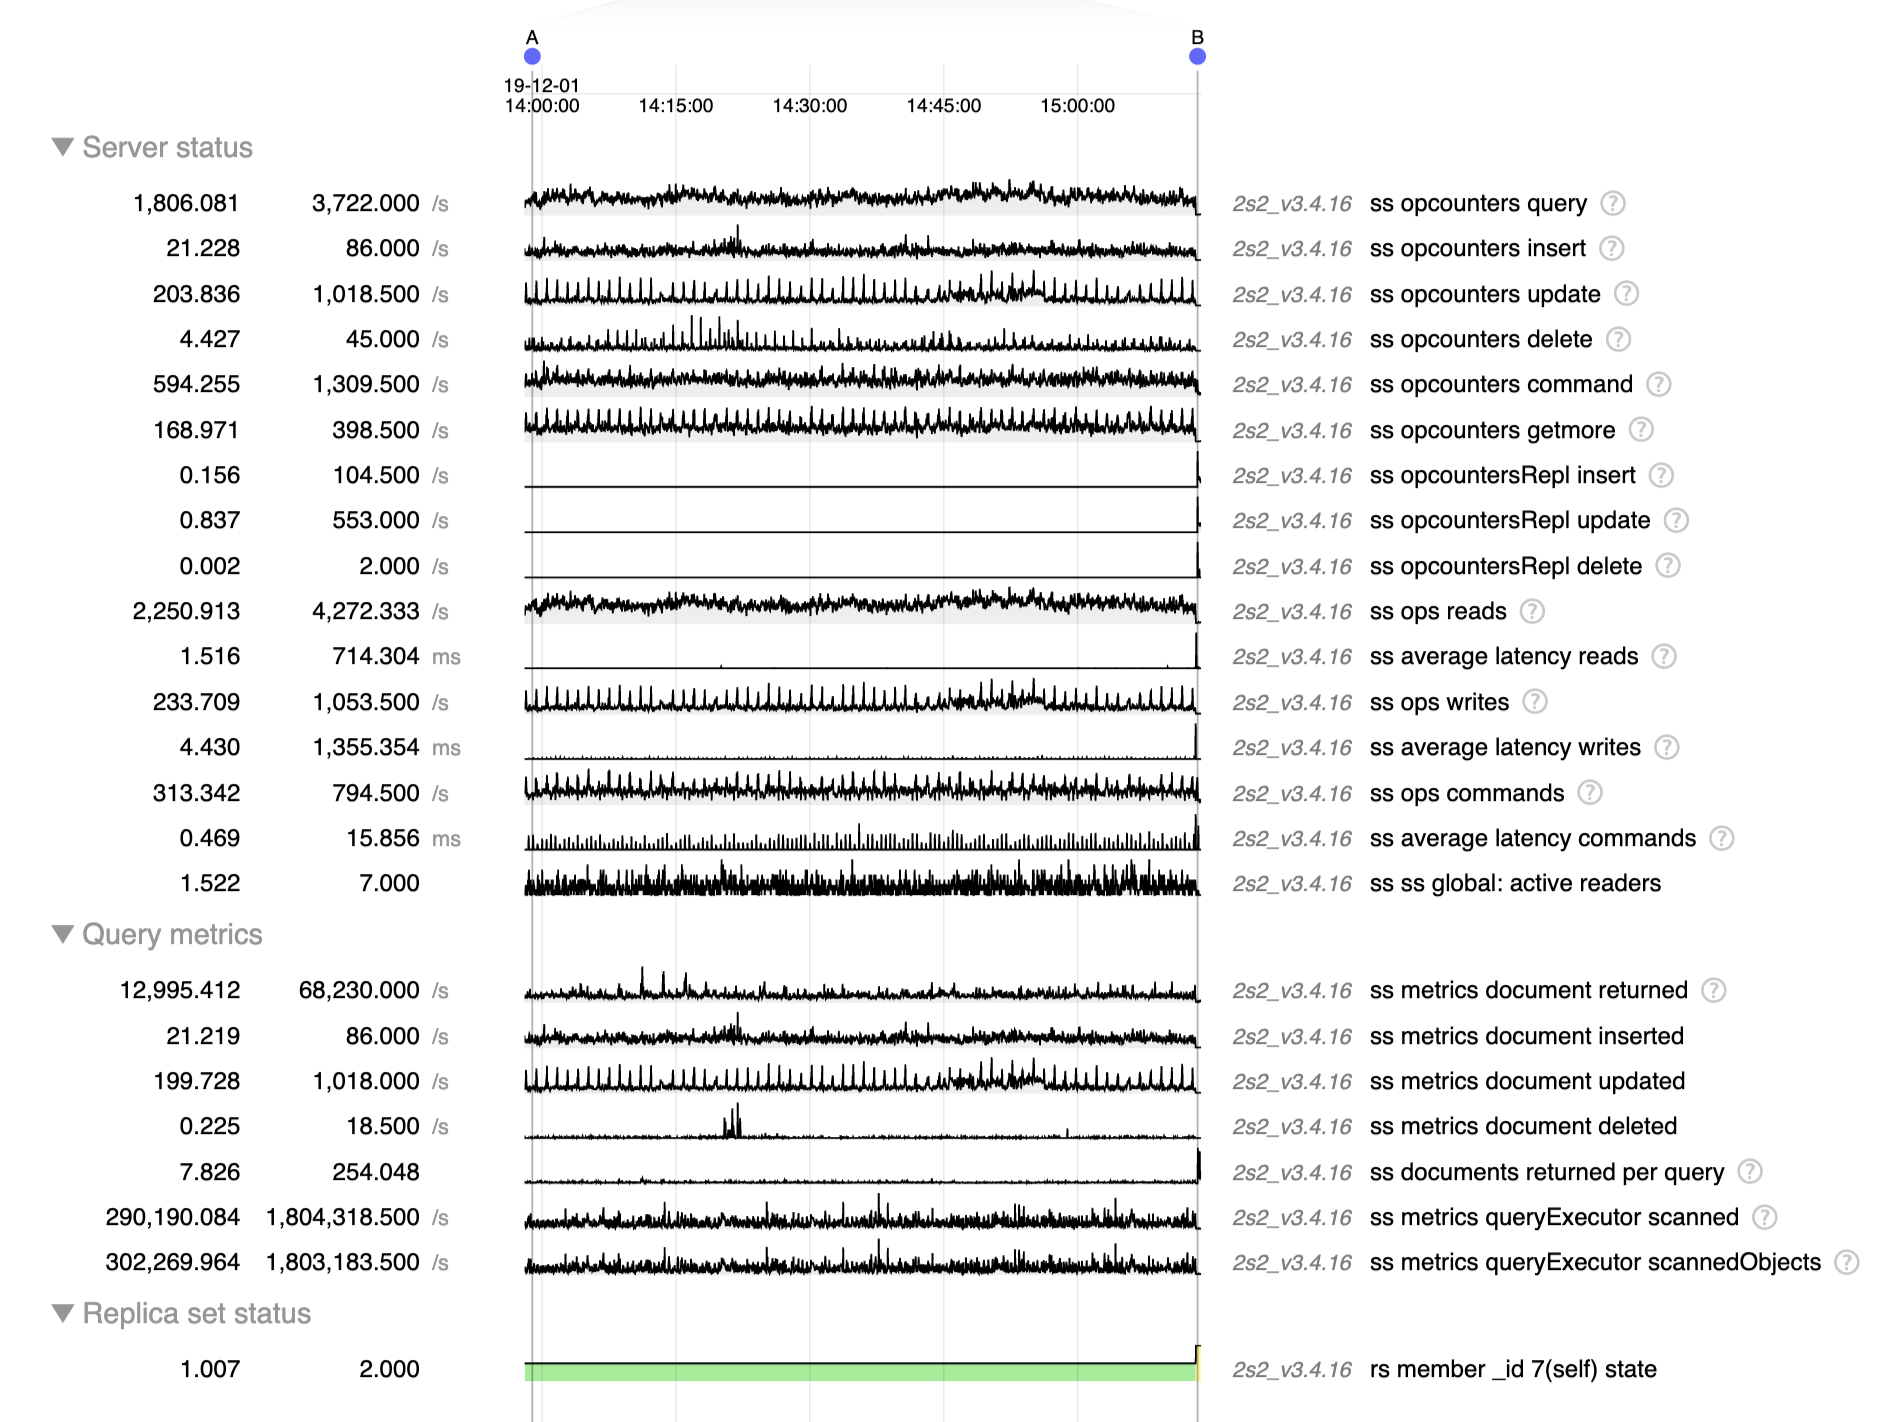
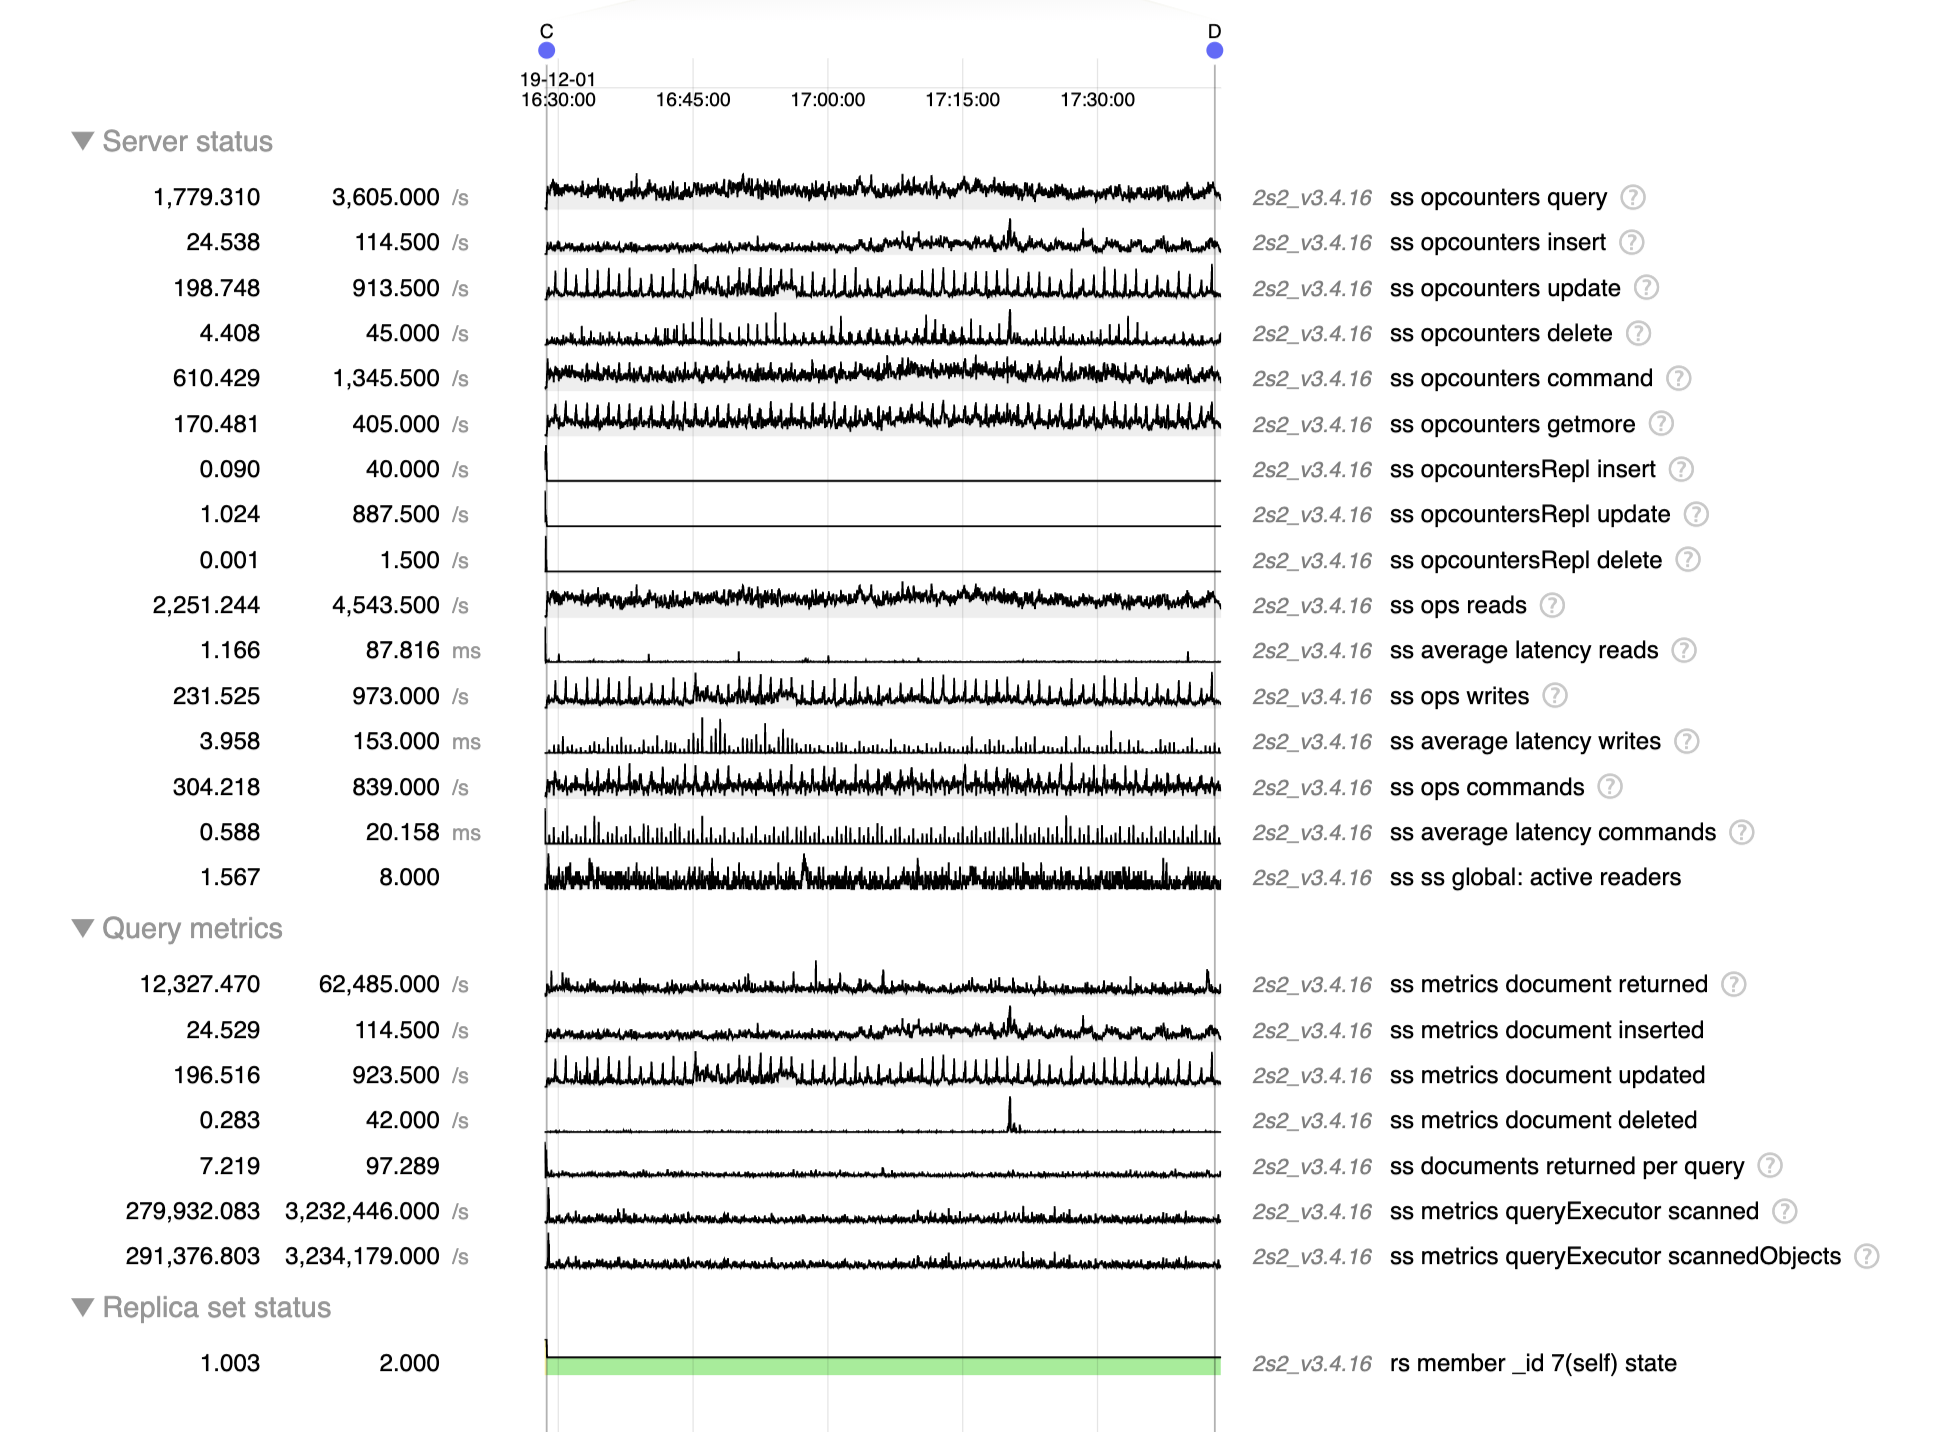
      But then more recently we started creating new indexes on our 2 RS (one is 3.4.16 only, and the other has the secondary on 3.6.13) and that's when the disaster came in, basically the 3.6.13 secondary was queuing page for eviction more than 10 times slower than that (looks capped at 3k pages/sec) even though the pressure generated by the index creation is bigger, meaning 95+ cache use pretty quickly whereas the 3.4.16 secondary was performing correctly.

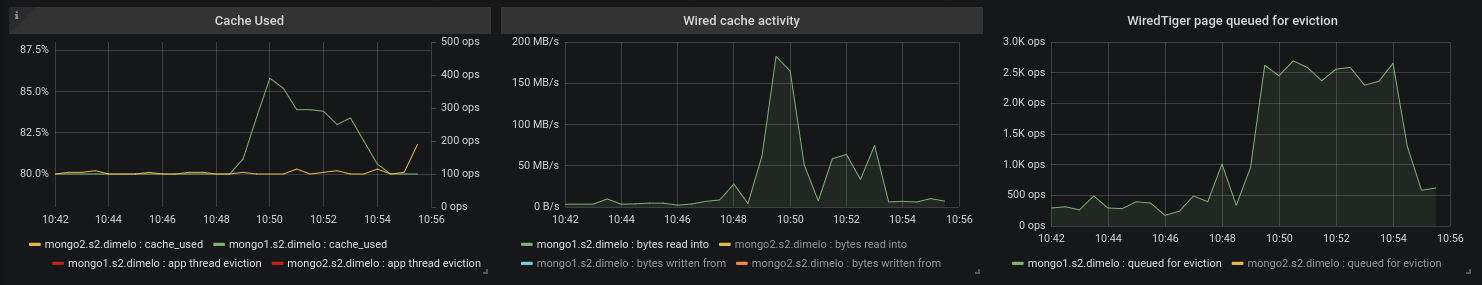
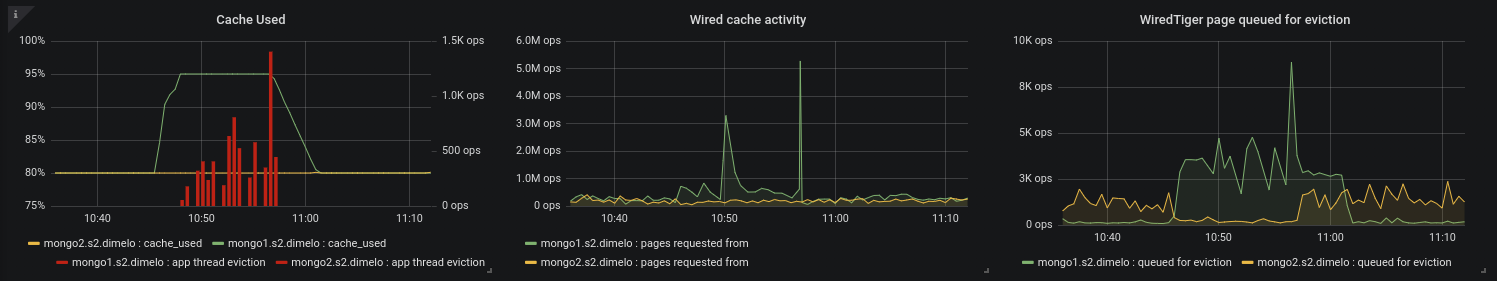
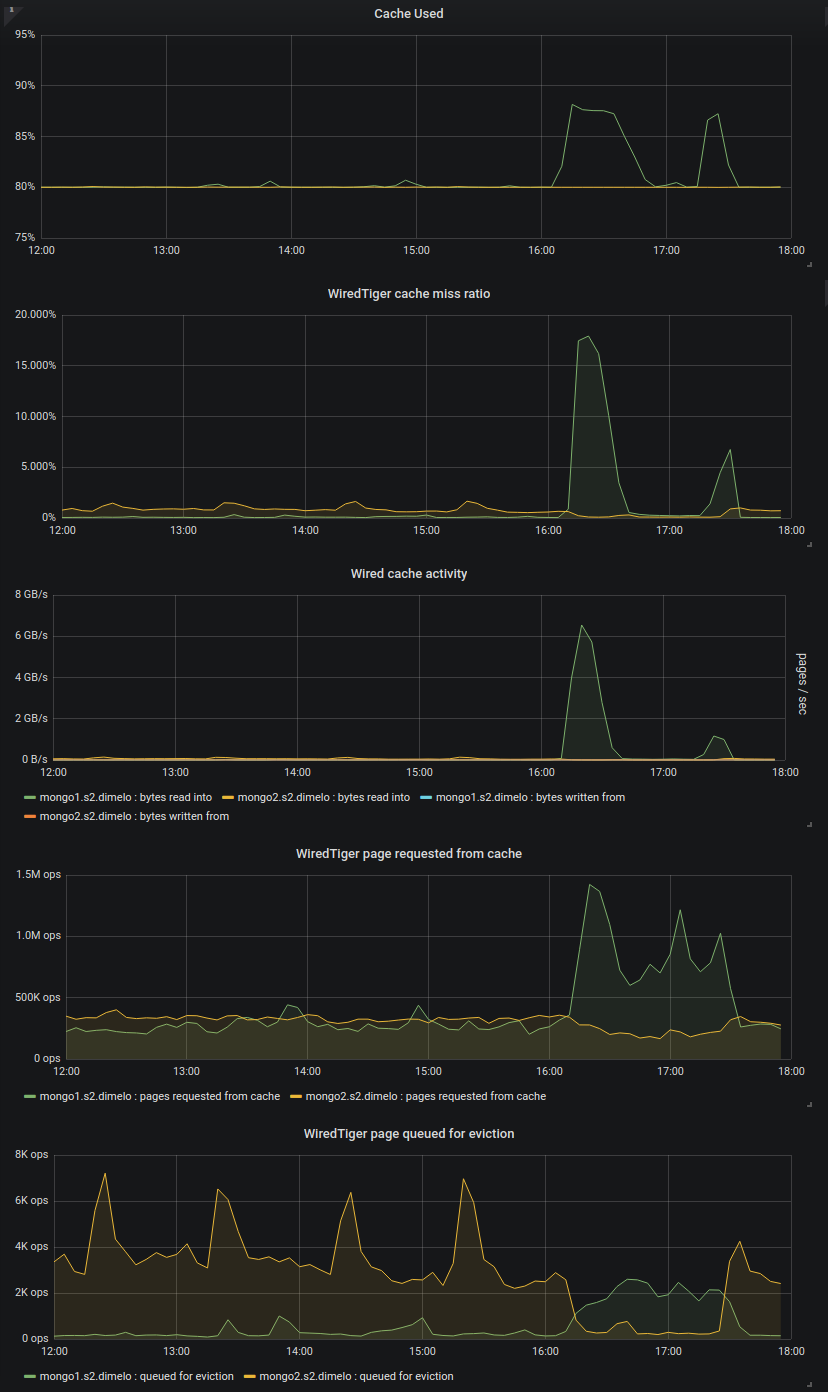
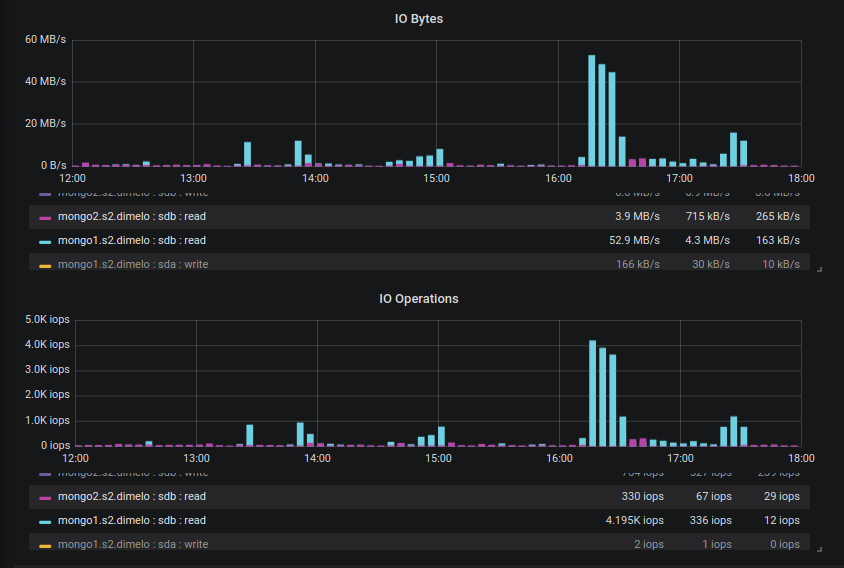
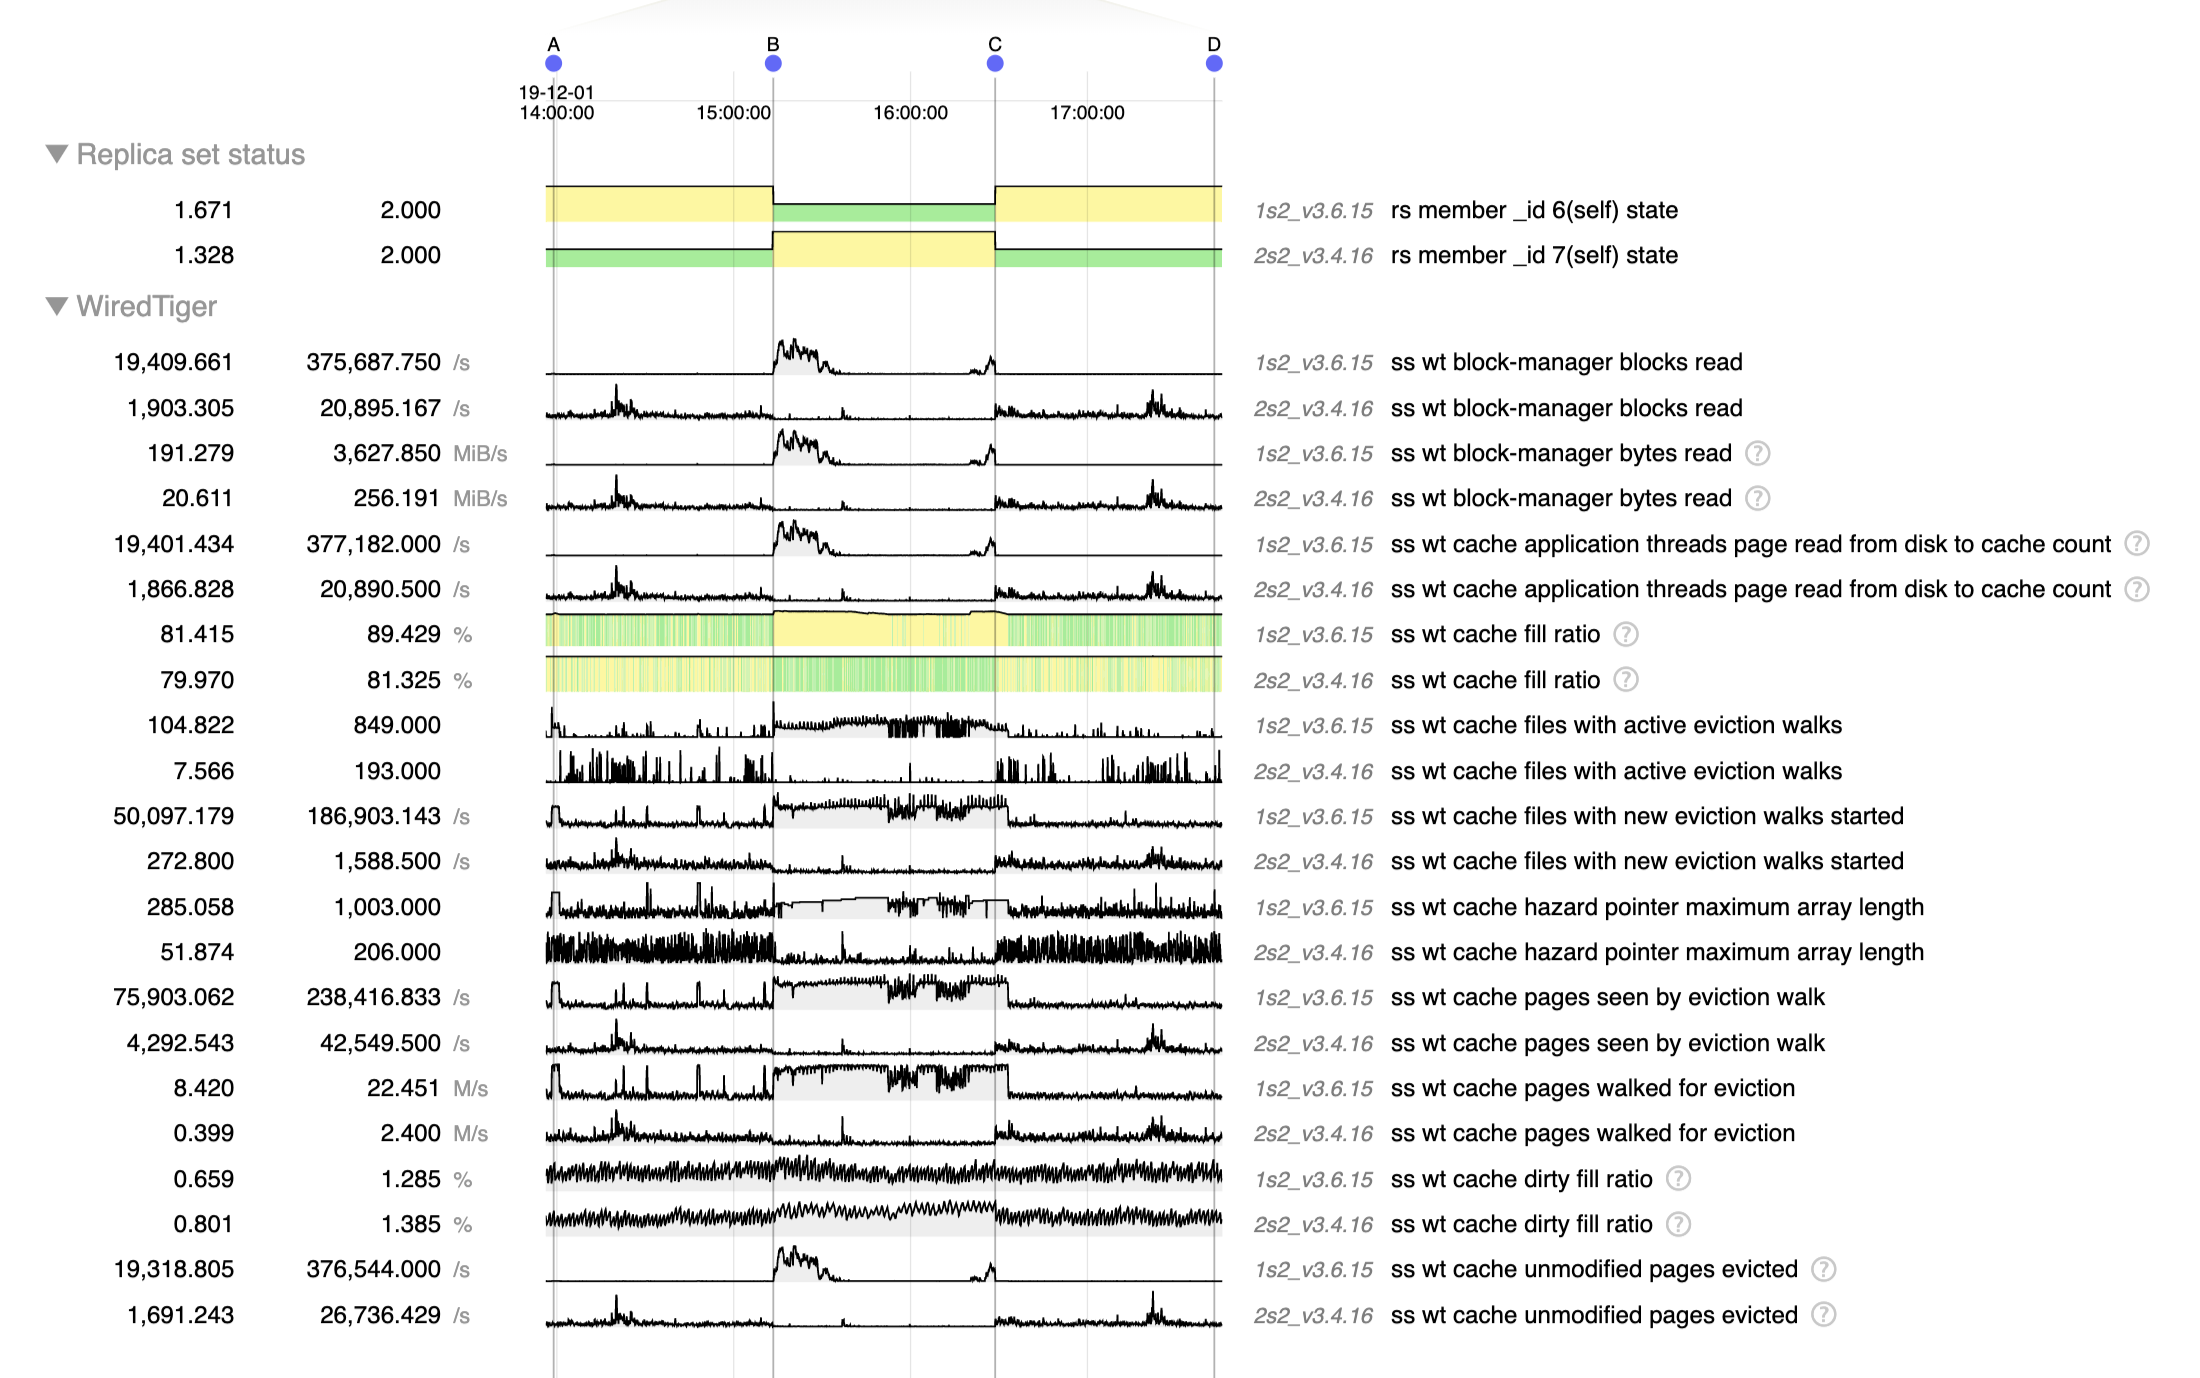
      We can see this well on this chart where we tried creating a couple indexes one by one on 1 RS then the other:

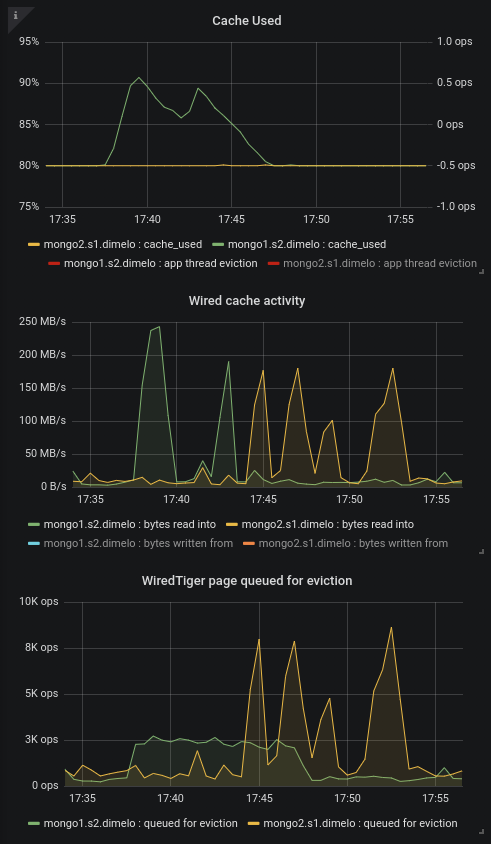
      Here we can see in green the 3.6.13 secondary and in yellow the 3.4.16 secondary.
      At 17:43 and 17:45 for example we created 2 identical index on similar collections, generating approximately the same pressure on the cache (in MB/s read), and we can see that 3.4.13 managed to queue pages for eviction at the same speed and thus keep the cache at 80% without trouble, whereas the 3.6.13 server looks capped at ~3k page/sec and this evict much slower than the cache fills up.

      This clearly looks like a huge performance regression to me, and it also mean we can't even risk putting 3.6.13 in production as it'll probably die the second we do it don't you think?

      You have the diagnostic.data already uploaded for these 2 servers during this operation in SERVER-42662, it was yesterday (August 7th) at 17:40 UTC+2

        1. image-2019-08-08-10-46-36-023.png
          image-2019-08-08-10-46-36-023.png
          105 kB
        2. image-2019-08-07-18-30-35-724.png
          image-2019-08-07-18-30-35-724.png
          109 kB
        3. Screen Shot 2019-08-08 at 3.55.23 PM.png
          Screen Shot 2019-08-08 at 3.55.23 PM.png
          626 kB
        4. eviction.png
          eviction.png
          603 kB
        5. image-2019-08-09-13-24-05-160.png
          image-2019-08-09-13-24-05-160.png
          80 kB
        6. screenshot-2.png
          screenshot-2.png
          84 kB
        7. screenshot-3.png
          screenshot-3.png
          89 kB
        8. screenshot-4.png
          screenshot-4.png
          81 kB
        9. screenshot-1.png
          screenshot-1.png
          346 kB
        10. screenshot-5.png
          screenshot-5.png
          35 kB
        11. screenshot-6.png
          screenshot-6.png
          89 kB
        12. screenshot-7.png
          screenshot-7.png
          79 kB
        13. screenshot-8.png
          screenshot-8.png
          71 kB
        14. screenshot-9.png
          screenshot-9.png
          95 kB
        15. screenshot-10.png
          screenshot-10.png
          89 kB
        16. screenshot-3.png
          screenshot-3.png
          61 kB
        17. screenshot-2.png
          screenshot-2.png
          60 kB
        18. Screen Shot 2019-10-23 at 12.44.55 PM.png
          Screen Shot 2019-10-23 at 12.44.55 PM.png
          560 kB
        19. index_creation_mongo_3_6_15_secondary.png
          index_creation_mongo_3_6_15_secondary.png
          140 kB
        20. mongo3_6_15_primary_cache.png
          mongo3_6_15_primary_cache.png
          130 kB
        21. mongo3_6_15_primary_ios.png
          mongo3_6_15_primary_ios.png
          48 kB
        22. mongo_3_4_16_vs_3_6_15_cache_cron.png
          mongo_3_4_16_vs_3_6_15_cache_cron.png
          113 kB
        23. mongo_3_4_16_vs_3_6_15_ios_cron.png
          mongo_3_4_16_vs_3_6_15_ios_cron.png
          47 kB
        24. mongo_3_6_8_cache.png
          mongo_3_6_8_cache.png
          138 kB
        25. mongo_3_6_8_cache2.png
          mongo_3_6_8_cache2.png
          128 kB
        26. Screenshot 2019-12-06 at 15.15.40.png
          Screenshot 2019-12-06 at 15.15.40.png
          796 kB
        27. 1s2_v3.6.15_B-C.png
          1s2_v3.6.15_B-C.png
          541 kB
        28. 2s2_v3.4.16_A-B.png
          2s2_v3.4.16_A-B.png
          600 kB
        29. 2s2_v3.4.16_C-D.png
          2s2_v3.4.16_C-D.png
          608 kB
        30. diag_A-B-C-D.png
          diag_A-B-C-D.png
          689 kB

            Assignee:
            rachelle.palmer@mongodb.com Rachelle Palmer
            Reporter:
            bigbourin@gmail.com Adrien Jarthon
            Votes:
            5 Vote for this issue
            Watchers:
            26 Start watching this issue

              Created:
              Updated:
              Resolved: