-
Type:
Bug
-
Resolution: Fixed
-
Priority:
 Major - P3
-
Affects Version/s: 4.4.0-rc6
-
Component/s: Diagnostics, Networking
-
None
-
Fully Compatible
-
ALL
-
v4.4
-
200
-
None
-
None
-
None
-
None
-
None
-
None
-
None
I ran the repro script in SERVER-48395 while sending mongod a SIGUSR2 every 10 seconds to collect stack traces. This resulted in network errors and failed operations at the application
Error: error doing query: failed: network error while attempting to run command 'insert' on host '127.0.0.1:27017' :
accompanied by messages from the mongo shell like
{"t":{"$date":"2020-05-25T15:07:29.723Z"},"s":"I",  "c":"NETWORK",  "id":20120,   "ctx":"js","msg":"Trying to reconnnect","attr":{"connString":"127.0.0.1:27017 failed"}}
{"t":{"$date":"2020-05-25T15:07:29.724Z"},"s":"I",  "c":"NETWORK",  "id":20125,   "ctx":"js","msg":"DBClientConnection failed to receive message","attr":{"connString":"127.0.0.1:27017","error":"HostUnreachable: Connection closed by peer"}}
The mongod logs tell a similar story:
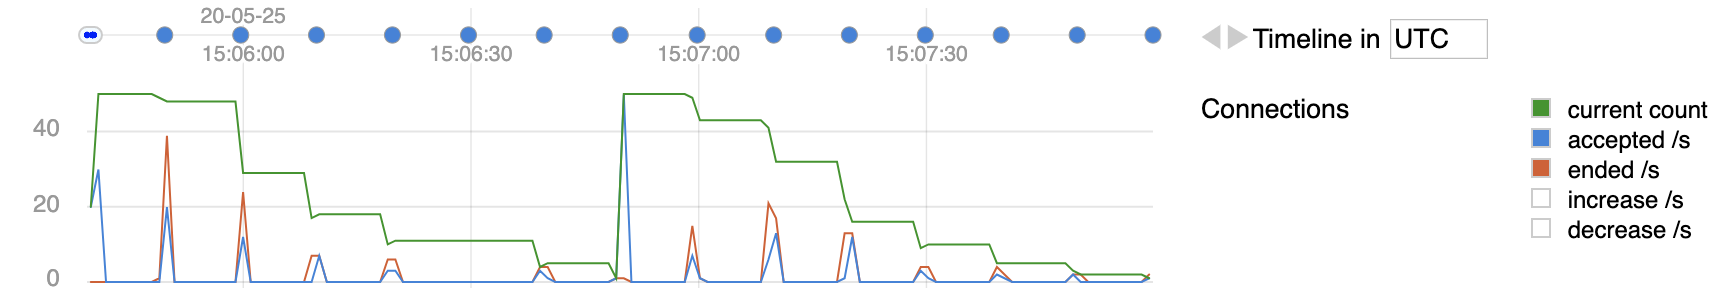
The blue markers on the timeline show the points at which SIGUSR2 was received. These are accompanied by some number of connections ended (red curve) and a smaller number of connections accepted (blue curve), resulting in a net decrease of connections each time (green curve)
I wonder if we might not be re-trying network operations when they return the EINTR that would result from SIGUSR2.

- is related to
-
-
- Closed
-
- related to
-
-
- Closed
-
-
SERVER-33445 Add signal handler to generate stack traces
-
- Closed
-