-
Type:
Bug
-
Resolution: Unresolved
-
Priority:
Major - P3
-
None
-
Affects Version/s: None
-
Component/s: None
-
None
-
Server Triage
-
ALL
-
None
-
None
-
None
-
None
-
None
-
None
-
None
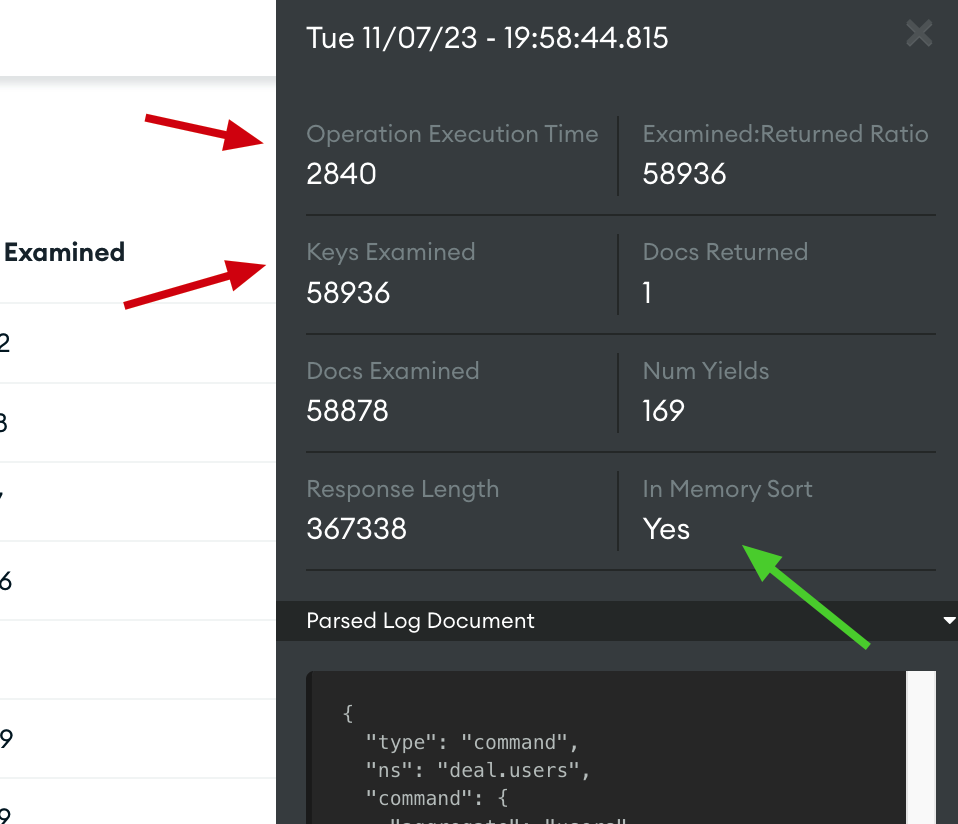
When i was checking profiler for slow queries i found a query that is marked as slow and it makes a memory sort and scans +58000 index keys
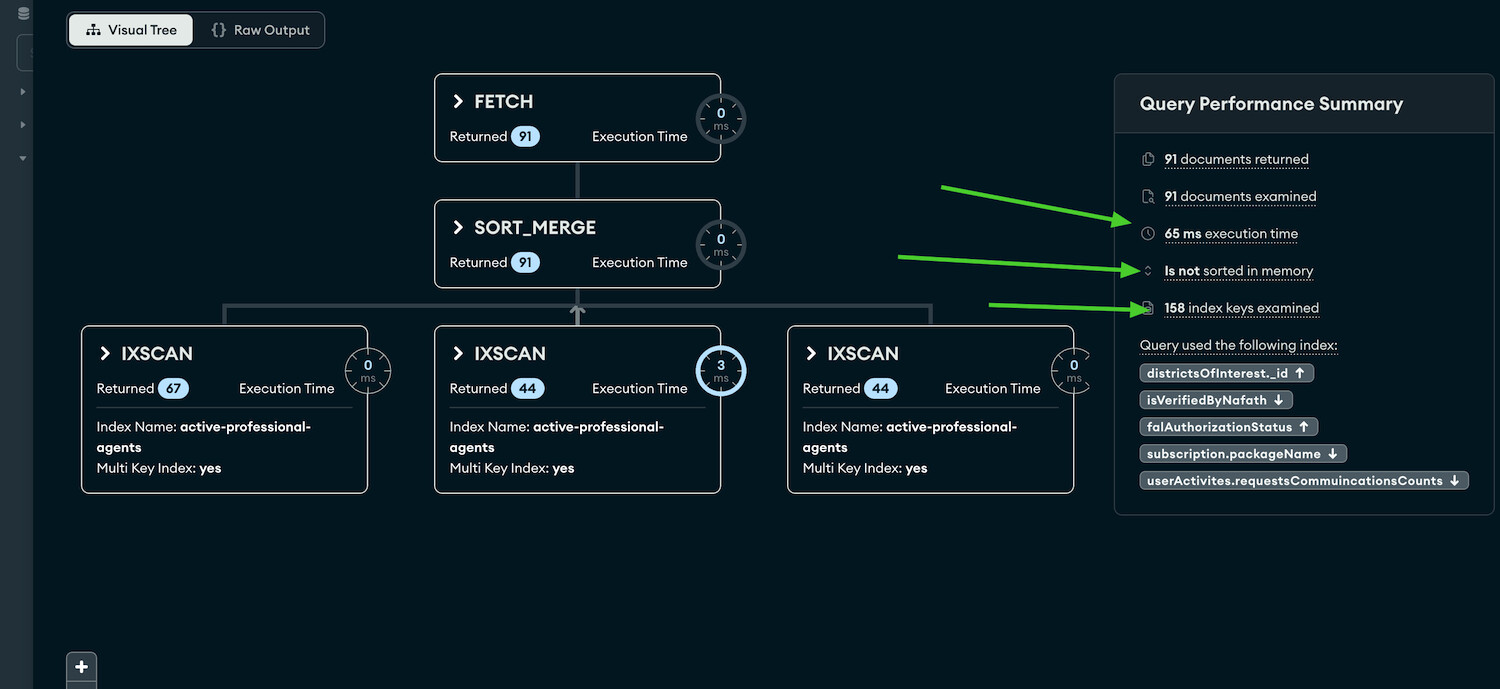
When i took the same query and i put it inside compass or from the shell it scans only 158 keys and no memory sort! This happens only when the query is coming from nodejs code using mongoose Version 8
i made a new M10 atlas cluster on v6.0.5 and tested it again from the nodejs app and it was used as expected this means the issue in v7
here is the result for the another query
this is the output of the profiler
and here is the full explain for the same query from compass (match and sort)
compass-explain.json![]()
and here is a list of all indexes on that collection
users-indexes.json![]()
You will notice in profiler report and the explain of compass the same index is used in both of them!
even though there is a big difference in examined keys

