-
Type:
Bug
-
Resolution: Done
-
Priority:
 Major - P3
-
Affects Version/s: 3.0.6, 3.1.7, 3.2.5, 3.3.5
-
Component/s: Performance, WiredTiger
-
Fully Compatible
-
ALL
-
None
-
None
-
None
-
None
-
None
-
None
-
None
ISSUE SUMMARY
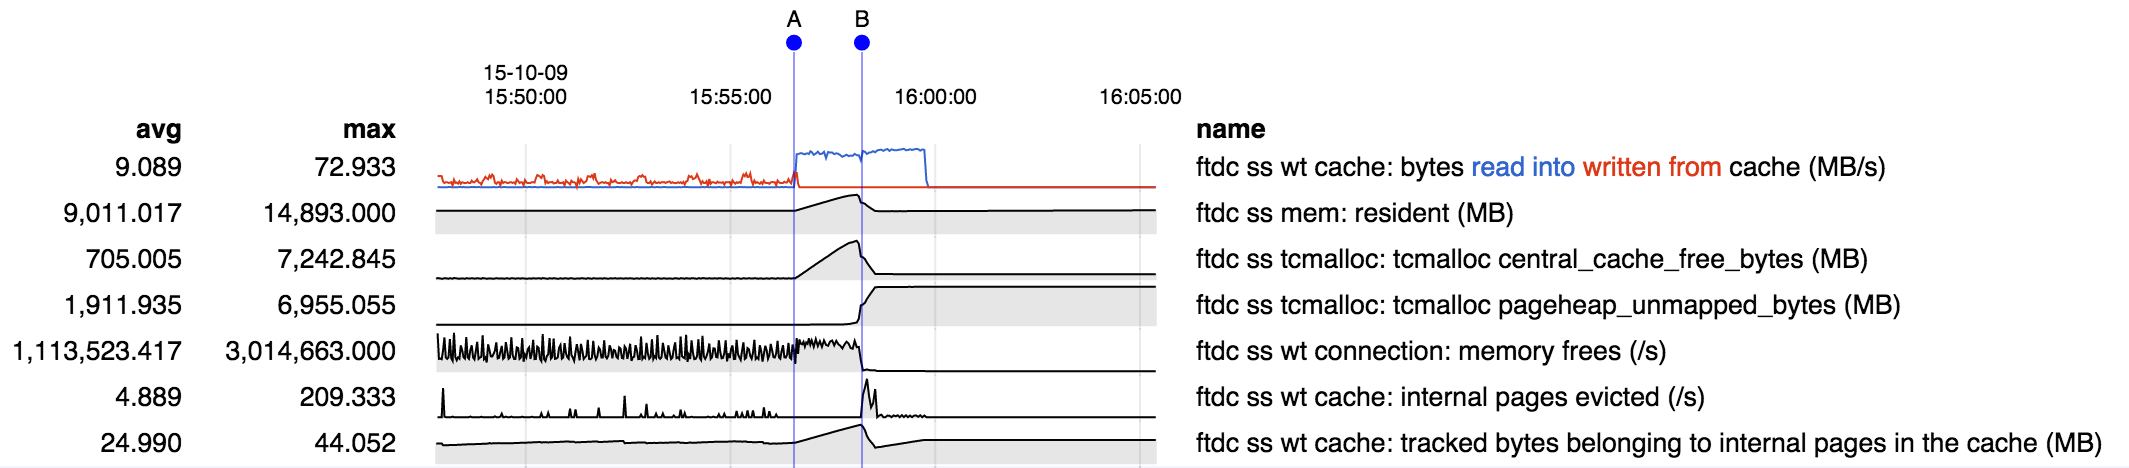
MongoDB with WiredTiger may experience excessive memory fragmentation. This was mainly caused by the difference between the way dirty and clean data is represented in WiredTiger. Dirty data involves smaller allocations (at the size of individual documents and index entries), and in the background that is rewritten into page images (typically 16-32KB). In 3.2.10 and above (and 3.3.11 and above), the WiredTiger storage engine only allows 20% of the cache to become dirty. Eviction works in the background to write dirty data and keep the cache from being filled with small allocations.
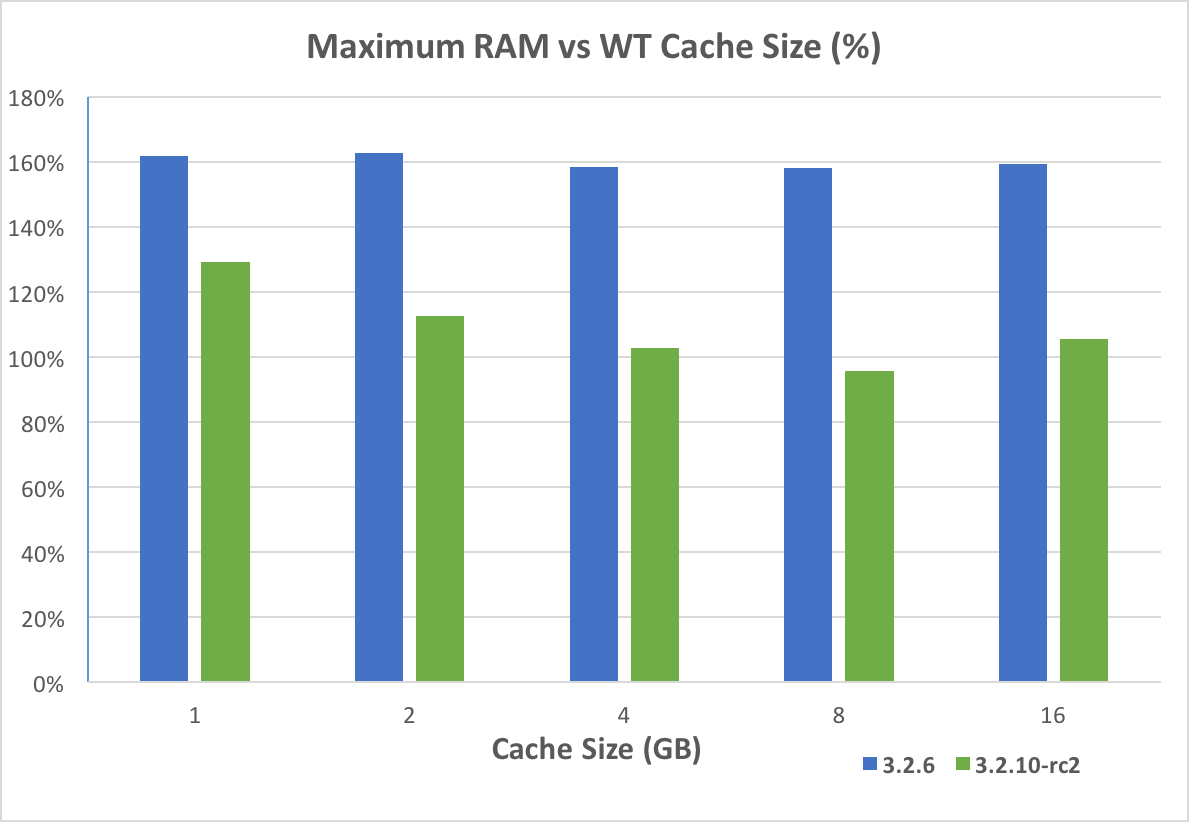
That changes in WT-2665 and WT-2764 limit the overhead from tcmalloc caching and fragmentation to 20% of the cache size (from fragmentation) plus 1GB of cached free memory with default settings.
USER IMPACT
Memory fragmentation caused MongoDB to use more memory than expected, leading to swapping and/or out-of-memory errors.
WORKAROUNDS
Configure a smaller WiredTiger cache than the default.
AFFECTED VERSIONS
MongoDB 3.0.0 to 3.2.9 with WiredTiger.
FIX VERSION
The fix is included in the 3.2.10 production release.
This ticket is a spin-off from SERVER-17456, relating to the last issue discussed there.
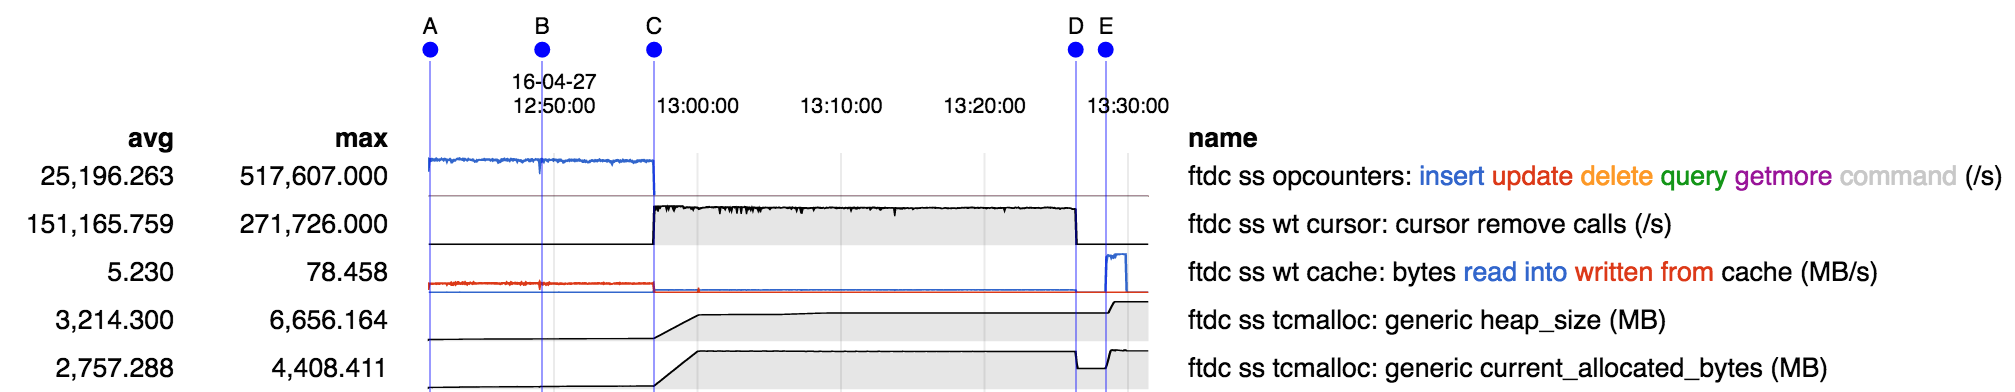
Under certain workloads a large amount of memory in excess of allocated memory is used. This appears to be due to fragmentation, or some related memory allocation inefficiency. Repro consists of:
- mongod running with 10 GB cache (no journal to simplify the situation)
- create a 10 GB collection of small documents called "ping", filling the cache
- create a second 10 GB collection, "pong", replacing the first in the cache
- issue a query to read the first collection "ping" back into the cache, replacing "pong"
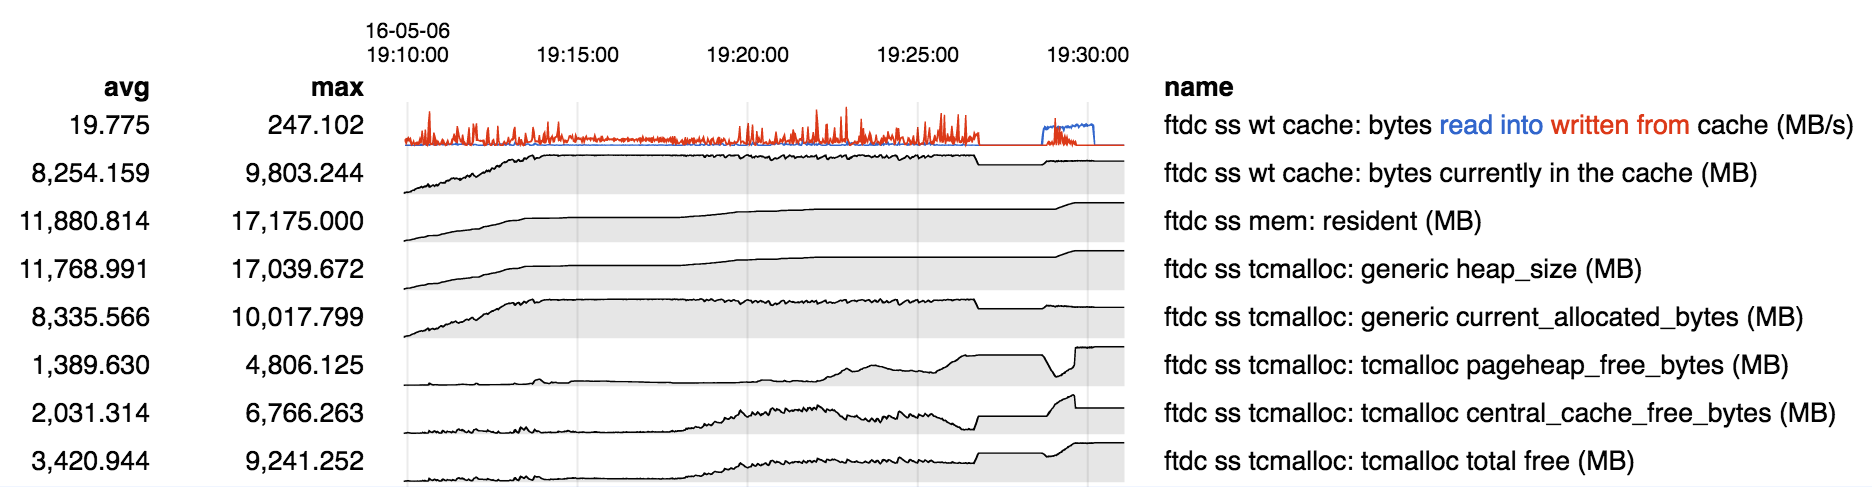
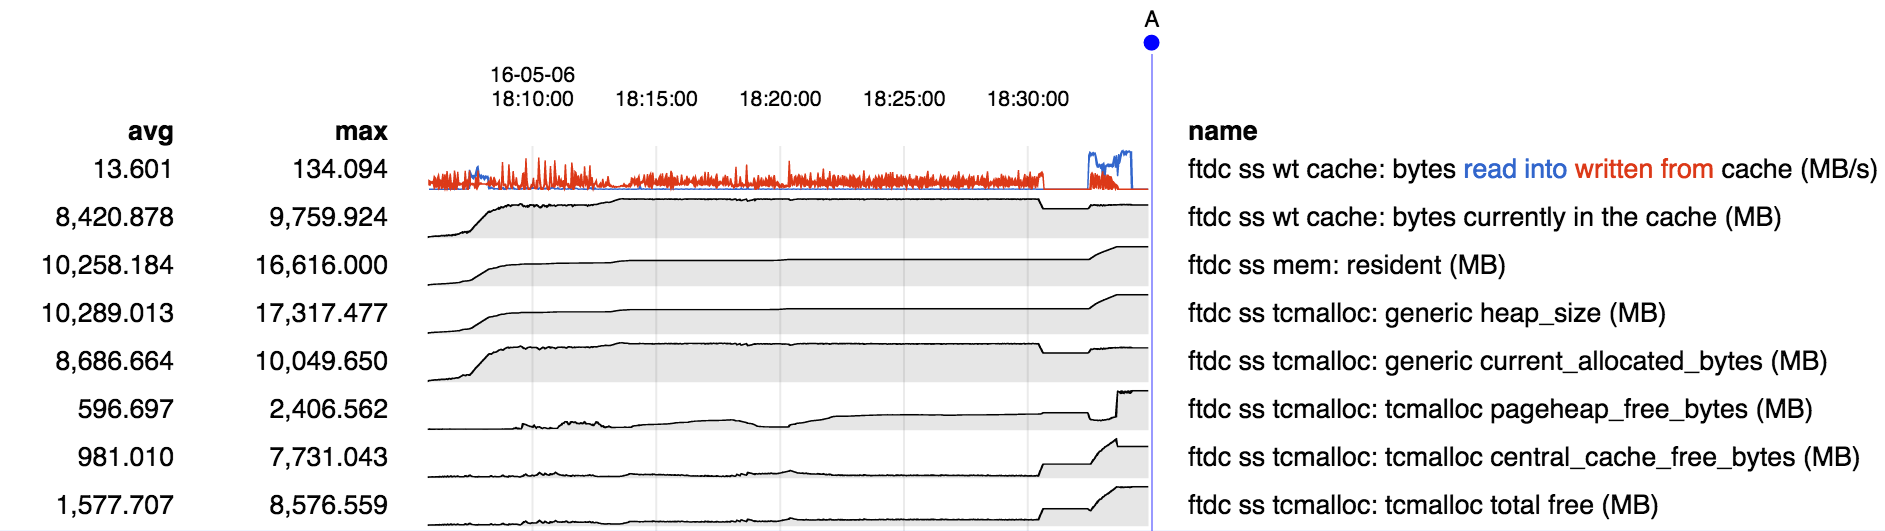
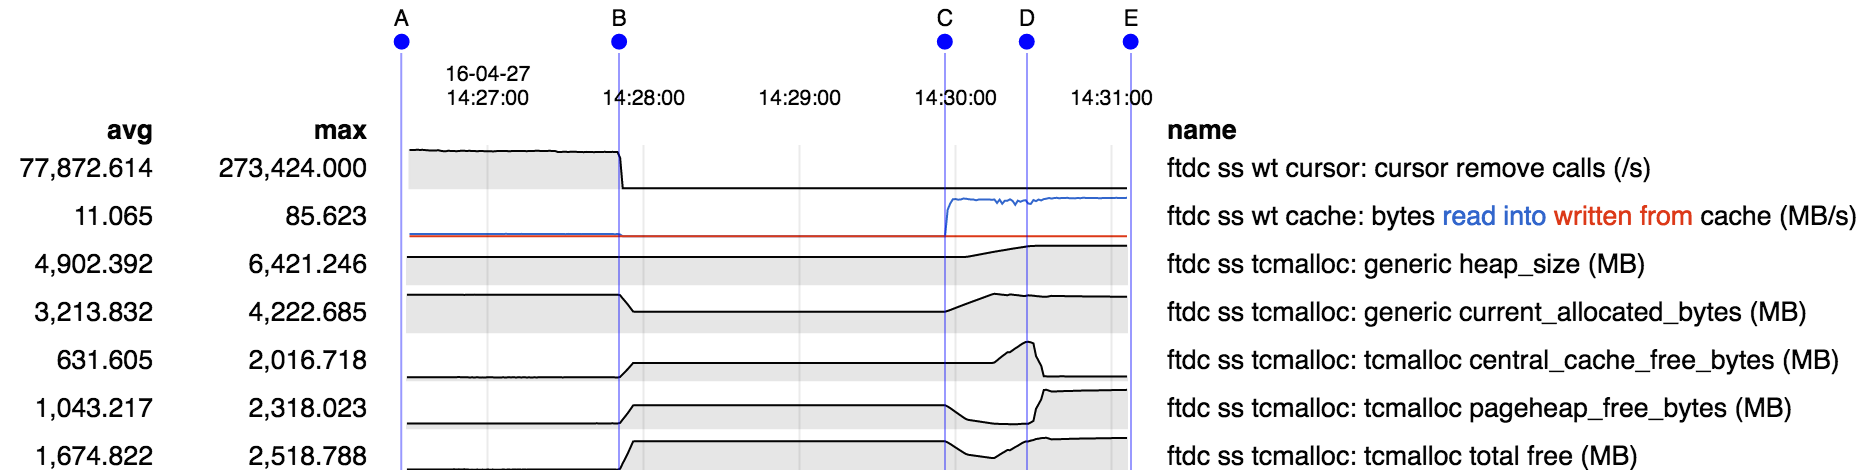
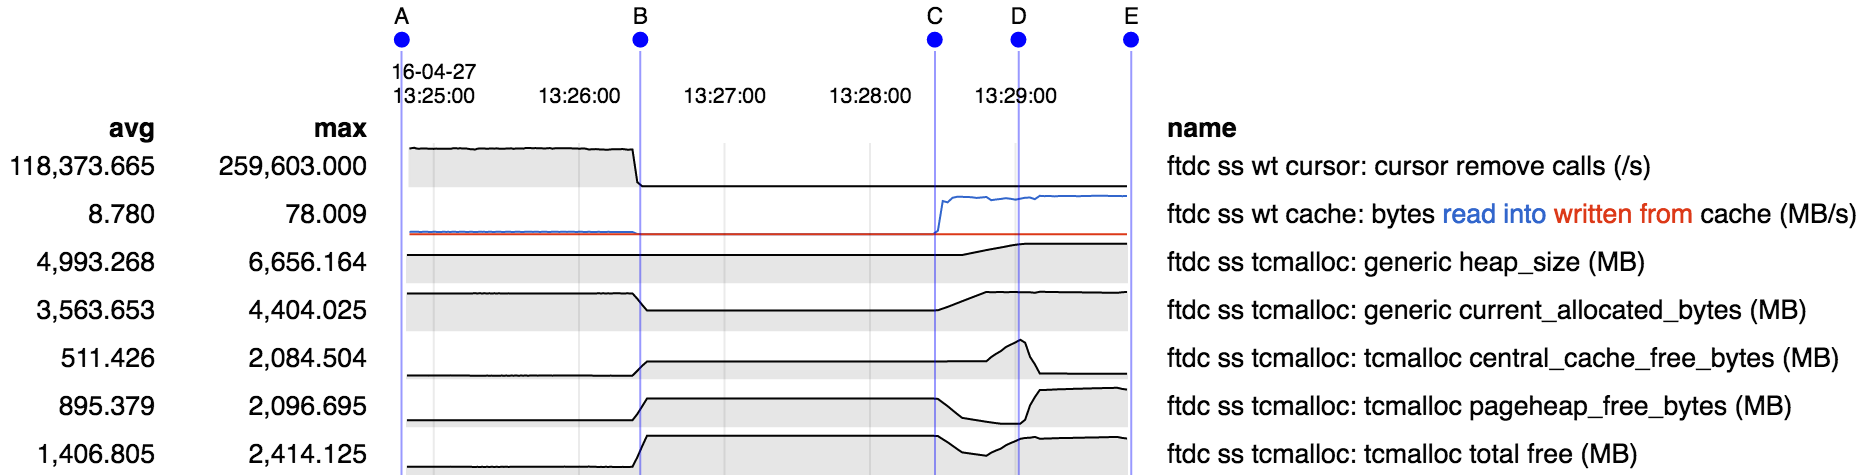
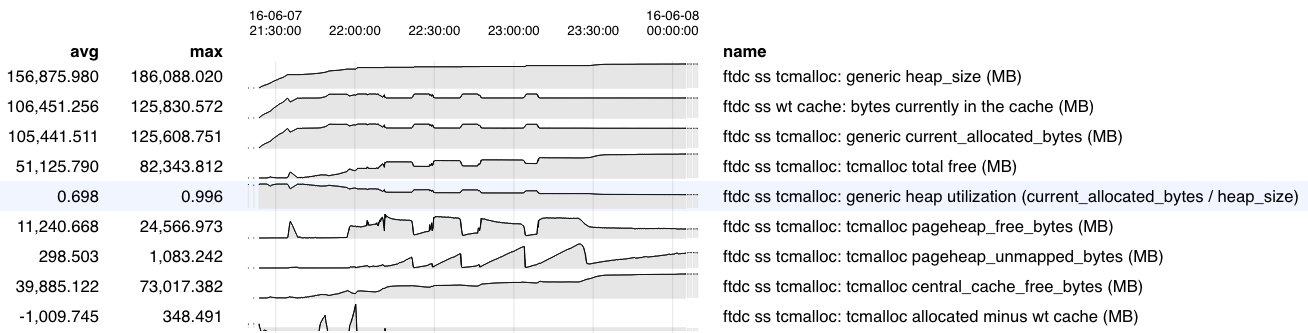
Memory stats over the course of the run:
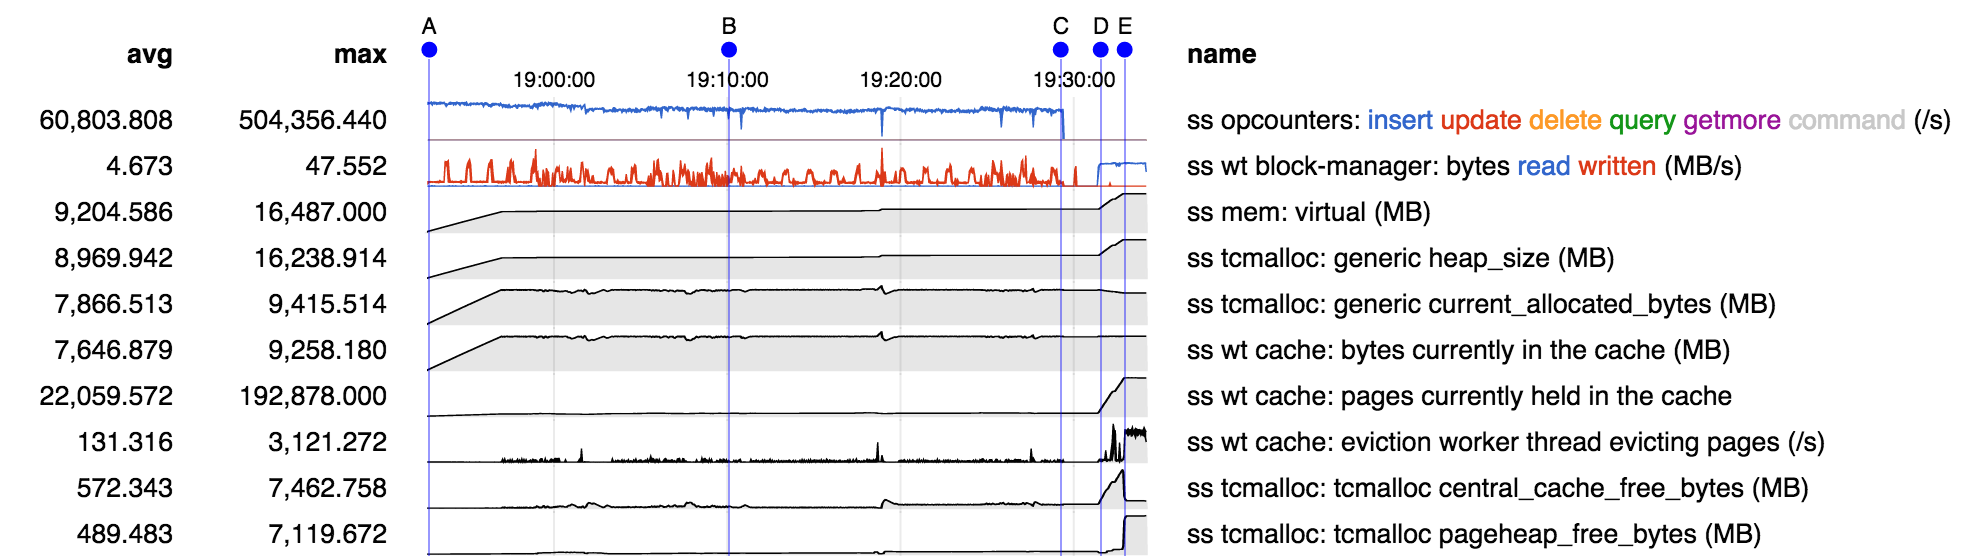
- from A-B "ping" is being created, and from C-D "pong" is being created, replacing "ping" in the cache
- starting at D "ping" is being read back into the cache, evicting "pong". As "pong" is evicted from cache in principle the memory so freed should be usable for reading "ping" into the cache.
- however from D-E we see heap size and central cache free bytes increasing. It appears that for some reason the memory freed by evicting "pong" cannot be used to hold "ping", so it is being returned to the central free list, and instead new memory is being obtained from the OS to hold "ping".
- at E, while "ping" is still being read into memory, we see a change in behavior: free memory appears to have been moved from the central free list to the page heap. WT reports number of pages is no longer increasing. I suspect that at this point "ping" has filled the cache and we are successfully recycling memory freed by evicting older "ping" pages to hold newer "ping" pages.
- but the net is still about 7 GB of memory in use by the process beyond the 9.5 GB allocated and 9.2 GB in the WT cache, or about a 75% excess.
Theories:
- smaller buffers freed by evicting "pong" are discontiguous and cannot hold larger buffers required for reading in "ping"
- the buffers freed by evicting "pong" are contiguous, but adjacent buffers are not coalesced by the allocator
- buffers are eventually coalesced by the allocator, but not in time to be used for reading in "ping"


- depends on
-
-
- Closed
-
- duplicates
-
-
- Closed
-
- is duplicated by
-
-
- Closed
-
-
-
- Closed
-
- is related to
-
-
- Closed
-
- related to
-
-

- Closed
-
-
SERVER-23069 Improve tcmalloc freelist statistics
-
- Closed
-