Uploaded image for project: 'Core Server'
  1. Core Server
  2. SERVER-17157

Seeing pauses in YCSB performance workload with WiredTiger

    • Type: Icon: Bug Bug
    • Resolution: Done
    • Priority: Icon: Critical - P2 Critical - P2
    • 3.0.6
    • Affects Version/s: 3.0.0-rc7
    • Component/s: WiredTiger
    • Labels:
    • Fully Compatible
    • ALL
    • Hide

      mongod is run with the following command line and no additional config file:

      numactl --physcpubind=0-15 --interleave=all mongod --dbpath <path to data> --logpath <path to log> --storageEngine=wiredTiger --logappend --quiet --fork
      

      This is using thumbtack-ycsb with the following config as the YCSB workload file:

      recordcount=10000000
      operationcount=2147483647
      workload=com.yahoo.ycsb.workloads.CoreWorkload
      readallfields=true
      readproportion=0.5
      updateproportion=0.5
      scanproportion=0
      insertproportion=0
      requestdistribution=zipfian
      threadcount=16
      maxexecutiontime=259200
      exportmeasurementsinterval=30000
      insertretrycount=10
      ignoreinserterrors=true
      readretrycount=1
      updateretrycount=1
      timeseries.granularity=100
      reconnectionthroughput=10
      reconnectiontime=1000
      

      It is run with a YCSB load

      <path to ycsb install>/bin/ycsb load mongodb -s -P <path to workload file>
      

      immediately followed by the YCSB run phase

      <path to ycsb install>/bin/ycsb run mongodb -s -P <path to workload file>
      

      Hardware wise, this is an Amazon Linux c3-4xlarge EC2 instance with 16 cores bound to the mongod instance

      The high number for the operationcount is that this particular run is target to a longevity test but the pauses start within the first 200 seconds and continues throughout the length of the run.

      Show
      mongod is run with the following command line and no additional config file: numactl --physcpubind=0-15 --interleave=all mongod --dbpath <path to data> --logpath <path to log> --storageEngine=wiredTiger --logappend --quiet --fork This is using thumbtack-ycsb with the following config as the YCSB workload file: recordcount=10000000 operationcount=2147483647 workload=com.yahoo.ycsb.workloads.CoreWorkload readallfields=true readproportion=0.5 updateproportion=0.5 scanproportion=0 insertproportion=0 requestdistribution=zipfian threadcount=16 maxexecutiontime=259200 exportmeasurementsinterval=30000 insertretrycount=10 ignoreinserterrors=true readretrycount=1 updateretrycount=1 timeseries.granularity=100 reconnectionthroughput=10 reconnectiontime=1000 It is run with a YCSB load <path to ycsb install>/bin/ycsb load mongodb -s -P <path to workload file> immediately followed by the YCSB run phase <path to ycsb install>/bin/ycsb run mongodb -s -P <path to workload file> Hardware wise, this is an Amazon Linux c3-4xlarge EC2 instance with 16 cores bound to the mongod instance The high number for the operationcount is that this particular run is target to a longevity test but the pauses start within the first 200 seconds and continues throughout the length of the run.

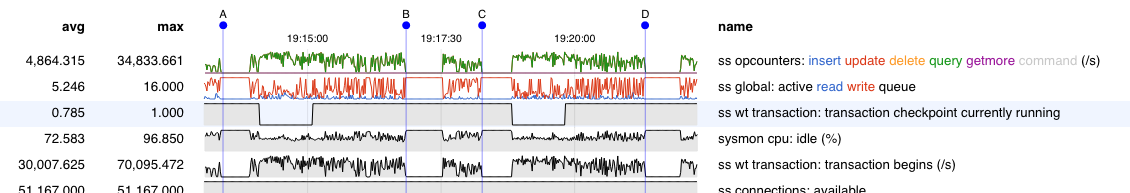
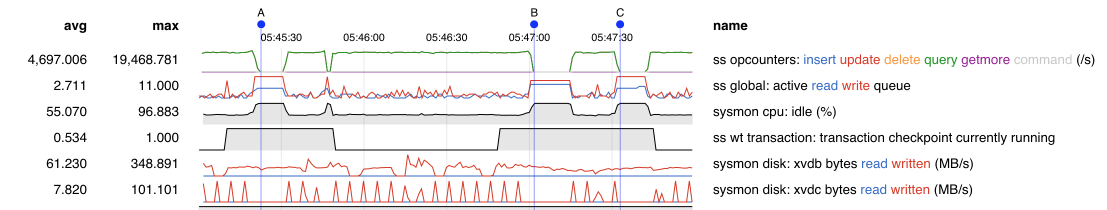
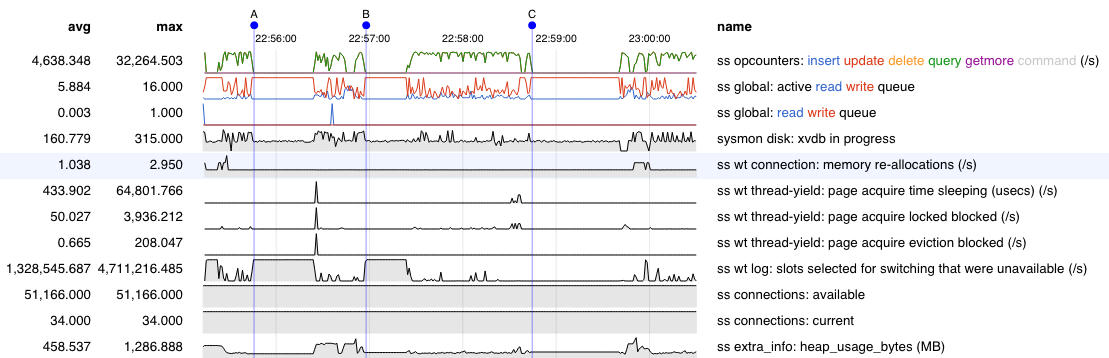
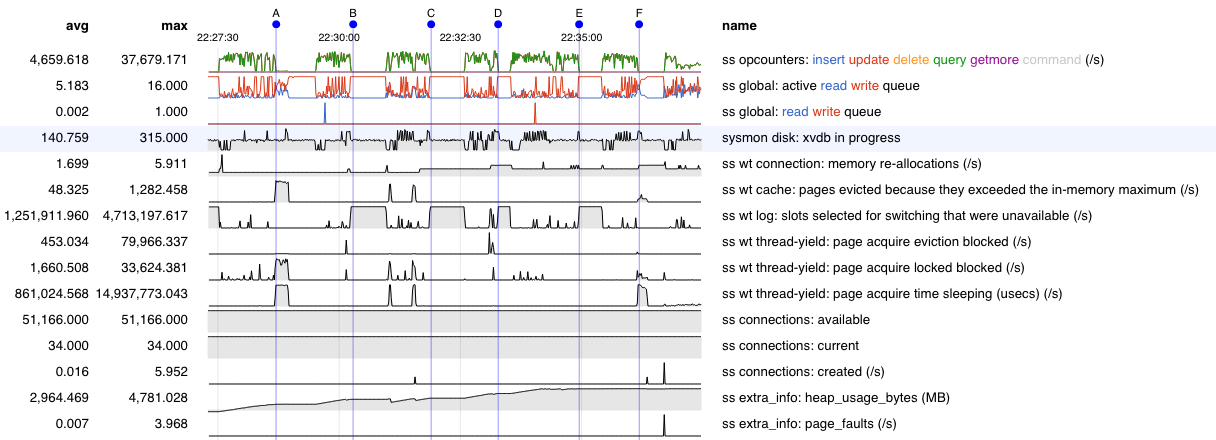
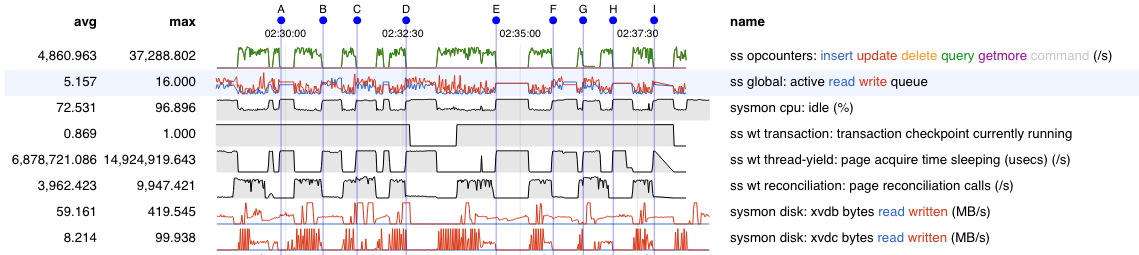
      During performance tests on a Amazon linux EC2 instance (dedicated c3-4xlarge) stand alone instance, I am seeing extended pauses during a mixed 50/50 update and read run that seem to correspond to high write activity in the general but no corresponding write activity in the disk or cache.

      The benchmark is running the mixed 50/50 workload of updates and reads. All the threads doing the reading are returning in a reasonable time giving low thread latency for Read threads. But the Update threads seem to be blocked. The latency when the updates start up again is showing as very high.

       388 sec: 10043995 operations; 10020.5 current ops/sec; [UPDATE AverageLatency(us)=2054.55] [READ AverageLatency(us)=1162.3]
       390 sec: 10134561 operations; 45260.37 current ops/sec; [UPDATE AverageLatency(us)=492.66] [READ AverageLatency(us)=203.15]
       392 sec: 10255505 operations; 60441.78 current ops/sec; [UPDATE AverageLatency(us)=333.89] [READ AverageLatency(us)=183.77]
       394 sec: 10329907 operations; 37201 current ops/sec; [UPDATE AverageLatency(us)=546.05] [READ AverageLatency(us)=211.6]
       396 sec: 10329907 operations; 0 current ops/sec;
       398 sec: 10329907 operations; 0 current ops/sec;
       400 sec: 10329907 operations; 0 current ops/sec;
       402 sec: 10329907 operations; 0 current ops/sec;
       404 sec: 10329907 operations; 0 current ops/sec;
       406 sec: 10329907 operations; 0 current ops/sec;
       408 sec: 10329907 operations; 0 current ops/sec;
       410 sec: 10329907 operations; 0 current ops/sec;
       412 sec: 10329907 operations; 0 current ops/sec;
       414 sec: 10329907 operations; 0 current ops/sec;
       416 sec: 10329907 operations; 0 current ops/sec;
       418 sec: 10329907 operations; 0 current ops/sec;
       420 sec: 10329907 operations; 0 current ops/sec;
       422 sec: 10358050 operations; 14071.5 current ops/sec; [UPDATE AverageLatency(us)=32062.47] [READ AverageLatency(us)=178.26]
       424 sec: 10409153 operations; 25538.73 current ops/sec; [UPDATE AverageLatency(us)=1044.98] [READ AverageLatency(us)=193.84]
       426 sec: 10520720 operations; 55755.62 current ops/sec; [UPDATE AverageLatency(us)=375.93] [READ AverageLatency(us)=186.22]
       428 sec: 10645124 operations; 62202 current ops/sec; [UPDATE AverageLatency(us)=319.98] [READ AverageLatency(us)=183.11]
       430 sec: 10759784 operations; 57301.35 current ops/sec; [UPDATE AverageLatency(us)=364] [READ AverageLatency(us)=182.66]
      

      Looking at the metrics is shows a large plateau in general write activity but there does not seem to be any noticeable uptick in write activity in WiredTiger, on disk (xvdb is data only disk) or in the cache. I have tested in full and not full cache modes with the same result.

      This appears similar to SERVER-16269,SERVER-16662 and is the same as what I was seeing in CAP-1822.

      This was actually tested with the b70d96e build (post rc7), but has been showing up in multiple RCs.

        1. 79492d9_raw.html
          2.14 MB
          Brian Towles
        2. 79492d9-pauses.png
          89 kB
          Brian Towles
        3. checkpoint_correlation.png
          36 kB
          Darren Wood
        4. drop_out.js
          0.5 kB
          Daniel Pasette
        5. from_js_replication_raw.html
          836 kB
          Brian Towles
        6. from_js_replication.png
          80 kB
          Brian Towles
        7. get_pauses_with_updates.js
          0.6 kB
          Brian Towles
        8. load_pause_data.js
          0.2 kB
          Brian Towles
        9. pause_issue_cache_full_raw.html
          1.34 MB
          Brian Towles
        10. pause_issue_cache_not_full_raw.html
          2.48 MB
          Brian Towles
        11. pause_issue_full_cache_2015-02-02 19-13-00.png
          122 kB
          Brian Towles
        12. pause_issue_not_full_cache_2015-02-02 19-13-00.png
          161 kB
          Brian Towles
        13. PauseStackTrace.txt
          184 kB
          Eitan Klein
        14. pstack.txt
          49 kB
          Neal Rigney
        15. server_15944_run.png
          122 kB
          Brian Towles
        16. server_17157_journal_on_xvdc_pstack.txt
          49 kB
          Brian Towles
        17. server_17157_journal_on_xvdc_raw.html
          1.71 MB
          Brian Towles
        18. server_17157_journal_on_xvdc.png
          93 kB
          Brian Towles
        19. SERVER_17157-DISK-ACTIVITY.png
          55 kB
          Brian Towles
        20. server-17157-rc9-long.png
          48 kB
          Darren Wood
        21. server-17157-rc9-zoom.png
          34 kB
          Darren Wood
        22. server17157-ycsbparams.txt
          0.4 kB
          Eitan Klein
        23. TCMalloc-YCSB.txt
          122 kB
          Eitan Klein
        24. wt-nochange.txt
          7 kB
          Eitan Klein
        25. wt-writethrough.txt
          13 kB
          Eitan Klein
        26. YCSB_pause_logs_sample.txt
          2 kB
          Brian Towles
        27. YCSB_workload
          0.4 kB
          Brian Towles
        28. ycsb5050-prerc9-norepl.png
          75 kB
          Darren Wood
        29. YCSB-zlib.txt
          185 kB
          Eitan Klein

            Assignee:
            michael.cahill@mongodb.com Michael Cahill (Inactive)
            Reporter:
            brian.towles Brian Towles
            Votes:
            1 Vote for this issue
            Watchers:
            23 Start watching this issue

              Created:
              Updated:
              Resolved: